Product Detail

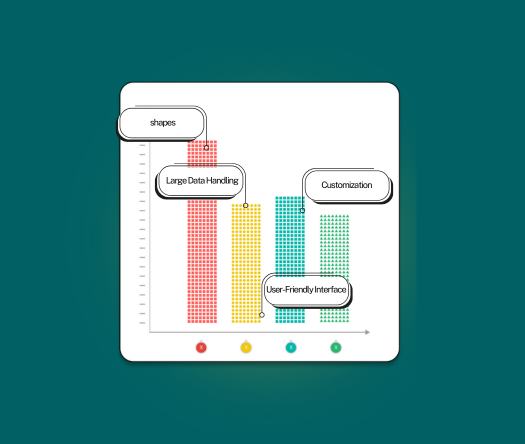
Icon Array Chart

Tool Is Certified by Microsoft:

Problem Statement

Organizations face challenges with traditional data visualization tools, including difficulties in representing complex datasets, limited insight into data distribution, and inadequate interaction and customization options. These issues hinder effective tracking of project milestones, reduce visibility into performance metrics, and lead to potential misinterpretations. The lack of dynamic, visually engaging tools decreases user engagement and requires time-consuming manual adjustments. Consequently, organizations struggle with inefficient data interpretation, ineffective tracking, and reduced productivity, ultimately impacting decision-making efficiency and overall performance.

Challenges

The Icon Array Chart by Office Solution addresses traditional data visualization challenges with advanced features like dynamic data handling for large datasets and color-coded icons for easy category distinction. It enhances insights with dynamic value visualization against benchmarks and provides detailed information through comprehensive tooltips. The chart also offers customization with a Top10 feature to focus on the top 5, 10, or all categories, and integrates a context menu for improved interaction and additional functionalities, making it a powerful tool for effective data representation and analysis.

Conclusion

The Icon Array Chart transforms traditional data representation by offering a visually engaging, interactive, and customizable tool that enhances data analysis and decision-making across various organizational functions.

Key Benefits:

  • Dynamic Data Handling: Efficiently manage large datasets.
  • Color-coded Categories: Distinguish data points with ease.
  • Dynamic Value Visualization: Visualize data distribution and progress against benchmarks.
  • Informative Tooltips: Access detailed insights on elements like total shapes and category labels.
  • Top10 Feature: Customize x-axis categories to show top 5, 10, or all.
  • Context Menu Integration: Enhance interaction with added functionalities.
  • Logo Removal: Option to remove branding.
  • Supports All Basic Features.
  • Project Managers: Track development stages of projects.
  • Sales & Marketing: Visualize campaign progress and metrics.

Other products

Office Solution Capacity Monitoring tool enables organizations to track Centrally:-

Bar Chart With Top N

The chart you are working with is designed to provide users with power

Line With Bubble Chart


Icon Array Chart

Icon Array Chart by office solution transforms traditional data repres

Magic Grid Advanced Analytics ChatGPT Solution

Magic Grid Advanced Analytics ChatGPT Solution

Stacker Bar Chart With Top N

Select Top N number of items to be displayed in chart and rest items w

Lorenz Curve Chart

Lorenz Curve by Office Solution

T

Barley Trellis chart

The Barley Trellis chart, inspired by Becker et al.'s groundbreaki

Tree View With Bar

Custom Tree View and Bar Chart, offering flexibility in managing column width and height, along w