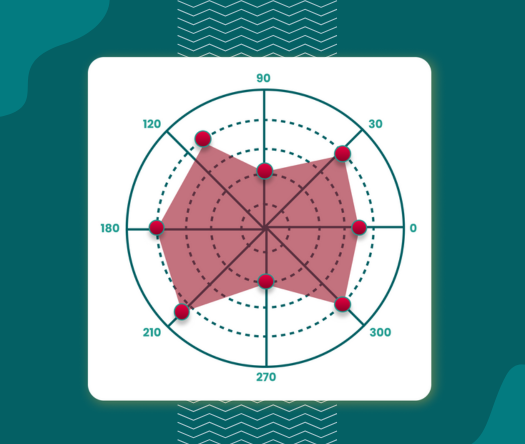
For more information visit our Microsoft app source link https://appsource.microsoft.com/en-us/product/power-bi-visuals/officesolution1640276900203.polar-scatter-plot-by-office-solution?tab=overview
Office Solution Capacity Monitoring tool enables organizations to track Centrally:-
Sales Velocity Chart
The Barley Trellis chart, inspired by Becker et al.'s groundbreaki
Supply Chain Network Flow Chart
The chart you are working with is designed to provide users with power
Empower users with dynamic bar charts, allowing real-time numeric aggr
The Fishbone Chart, also known as an Ishikawa or cause-and-effect diag
Lorenz Curve by Office Solution
T
The Circular Dendrogram Chart offers a unique and vis