Architecting an Enterprise Data Strategy: The Practical Engineering Roadmap to Migrate Tableau to Power BI
 0|
0| 0
0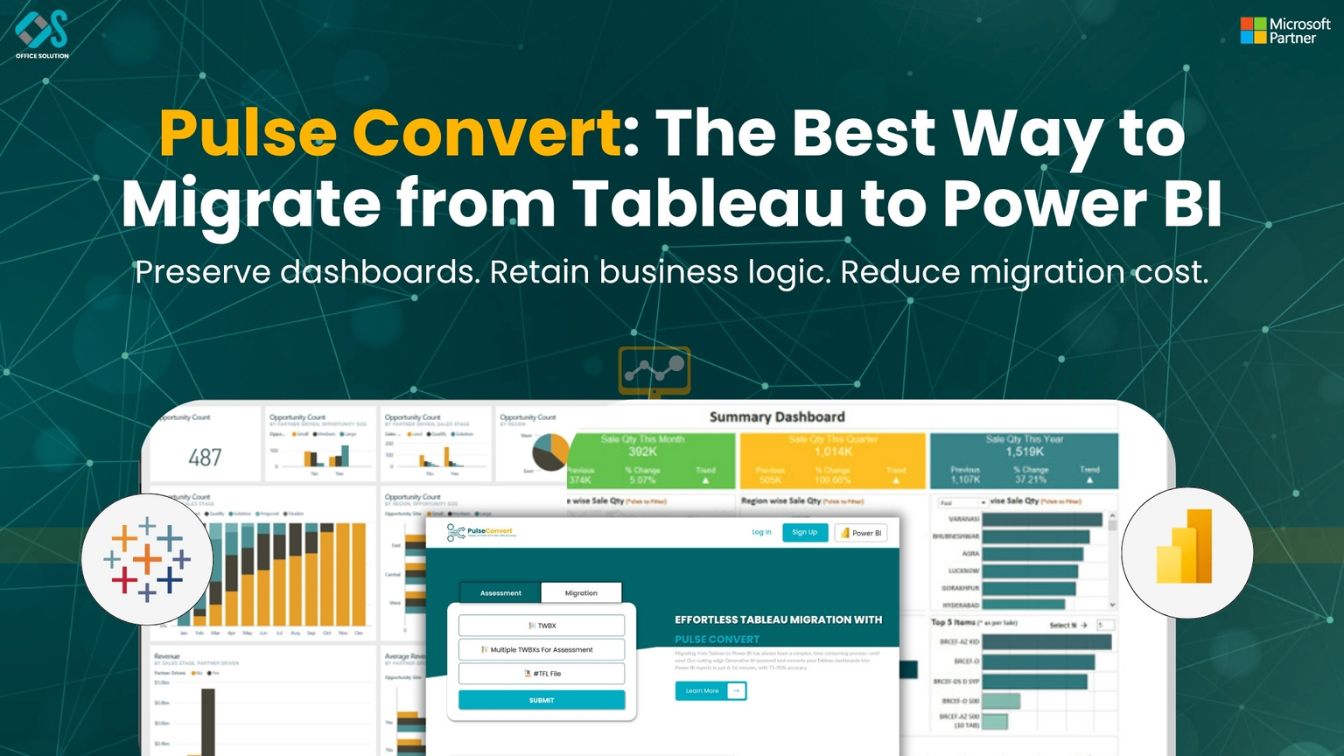
Table of Contents
The Tactical Reevaluation of Enterprise Analytics Frameworks
Modern corporate technology environments are undergoing a period of intense structural consolidation. For global organizations managing massive, highly complex database landscapes, business intelligence applications are no longer treated as isolated calculation tools isolated within specific departments. Instead, business intelligence platforms function as the central nervous system of corporate operations, orchestrating executive decisions, financial tracking, and real-time operational workflows. As chief information officers and technology directors seek to optimize cloud infrastructure spending, eliminate unnecessary software redundancies, and deeply integrate data services with existing cloud ecosystems, a major industry consensus has emerged across the United States enterprise market: a widespread corporate initiative to manage a complete Power BI migration from Tableau.
The historical approach of allowing individual business teams to independently purchase and maintain separate visualization packages has created significant operational inefficiencies. Corporate IT departments are frequently left managing fragmented analytical environments where separate data gateways must be maintained, security patches applied across disparate vendor software, and redundant software subscription costs absorbed by the corporate bottom line. When an organization chooses to migrate Tableau to Power BI, it is initiating an intentional architectural alignment. This modernization consolidates disjointed visualization portfolios into a single cloud infrastructure ecosystem, reducing maintenance complexities and establishing a unified framework for enterprise data governance.
By establishing Microsoft Power BI as the global corporate standard for visual analytics, enterprises can maximize their existing corporate enterprise licensing, simplify upstream and downstream data engineering pipelines, and ensure that a single semantic model serves as the foundation for departmental insights. This technical alignment eliminates data contradictions that occur when different corporate divisions present conflicting metrics during critical executive board meetings. It guarantees that operations managers, financial analysts, and regional executives are drawing conclusions from an identical, validated source of truth. This structural optimization dramatically drops technical debt while accelerating the deployment of reliable analytics.
However, extracting a mature reporting architecture from an established legacy visualization framework like Tableau presents deep technical challenges. Legacy dashboards are frequently intertwined with complex local queries, unstructured data blends, and unique, system-specific calculation logic. Viewing a business intelligence migration as a basic design duplication project will inevitably result in project delays, broken report calculations, and poor user adoption. To ensure success, data engineering teams must deploy a disciplined, phased execution strategy built upon an understanding of the fundamental structural differences between both analytical engines.
Breaking Down the Core Structural Paradigms
To construct an effective conversion strategy, enterprise migration architects must evaluate the core structural traits that distinguish both business intelligence environments. The legacy platform utilizes an agile, visualization-first paradigm. In this environment, reports are traditionally built by linking flat, unmodeled data exports directly to a visual canvas, using custom table joins and visual data blending to shape information on the fly. Its underlying calculation engine is heavily dependent on Level of Detail (LOD) formulas, which calculate metrics at highly specific dimensional granularities that frequently override the active filters running on the user interface dashboard.
In stark contrast, the target platform is strictly architected as a data-modeling-first environment. It achieves superior query speeds and robust scalability by requiring data to be organized into relational star schemas, where clean fact tables are linked to fully optimized dimension tables through structured relationships. Calculations are executed through Data Analysis Expressions (DAX), a functional language that evaluates data based on active row contexts and dynamic filter modifications. Because the legacy system modifies data groupings locally inside individual chart cards while the target platform manages data relationships globally across an interactive semantic layer, evaluating a comprehensive Tableau vs Power BI 2026 comparison is mandatory before starting any development work.
This fundamental difference means that trying to copy calculation formulas directly without re-engineering the underlying data shape will lead to broken visuals, sluggish dashboard interactions, and completely inaccurate data totals. For instance, a legacy formula that locks in a specific dimension regardless of user interactions must be entirely refactored as a context-aware calculation in the new environment. Data teams must uncover the original business objective of each legacy calculation and write fresh code designed to execute over a relational schema. Ignoring this calculation shift leads to severe query lag, forcing developers to spend weeks fixing performance issues after a report goes live, a scenario thoroughly analyzed in our complete guide using Tableau to Power BI migration.
Step-by-Step Tableau to Power BI Migration Process
Re-architecting an entire corporate analytics footprint demands a highly structured execution framework to maintain data continuity, guarantee metric alignment, and avoid business downtime during deployment.
Automated Infrastructure Audit and Portfolio Analysis
The transition framework begins with an extensive automated audit of the active source reporting server. Over several years of corporate operations, enterprise servers naturally accumulate hundreds of redundant, outdated, or completely unread dashboards. Attempting to convert every single workbook without analyzing server metadata first introduces massive technical debt into the target workspace, wasting time and budget on reports that business users no longer require.
By extracting system logs, engineers can map out the entire reporting environment, separate high-value corporate dashboards from dead files, and safely retire outdated assets to focus migration efforts on critical operational tools.
Target Semantic Blueprinting and Star Schema Design
Next, data architects must design a rock-solid data foundation by building optimized semantic models within the target workspace. This phase requires converting old, flat data collections into clean star schemas with dedicated dimension and fact tables.
This stage is also the optimal moment to centralize data transformation logic, shifting data cleaning steps away from individual reports and into shared, reusable cloud data flows to ensure every business group across the company uses identical metric baselines, a strategy outlined in our comprehensive technical enterprise Tableau to Power BI migration 2026 guide.
Calculation Logic Translation and Filter Context Engineering
Re-authoring complex business calculations represents the most technically demanding milestone of any migration project. Because legacy calculation styles operate independently of active user dashboard selections, recreating them in the target platform requires an advanced understanding of evaluation context and filter overrides.
Data engineers must carefully translate old dimension-locked formulas into optimized, functional measures, ensuring that page filters apply correctly across all reporting visuals and generate completely accurate data outputs.
Canvas Interface Modernization and Responsive Design
When rebuilding user interfaces, development teams should resist the urge to copy legacy dashboard layouts pixel-for-pixel. Instead, utilize the migration to upgrade user experiences by leveraging native grid alignments, clean visual containers, and standard corporate color themes.
Limit each reporting page to four or five high-impact visual components to keep query overhead low and ensure business users can find key operational metrics quickly without encountering cluttered dashboard screens.
Side-by-Side Validation and Governance Implementation
Run exhaustive data validation routines to confirm that all metrics match legacy numbers exactly under identical filter combinations. Once data precision is established, test the reporting system under true production workloads. Verify cloud data gateway stability, check data refresh schedules, and confirm that role-based security rules restrict access to sensitive corporate information based on the specific profiles defined in your corporate identity system, following the methodologies detailed in our guide on Tableau to Power BI migration comprehensive technical guide 2026.
Adoption Delivery and Center of Excellence Activation
The final stage of the transition focuses on user adoption and platform management. Achieving high long-term adoption requires a structured change management initiative that supports business analysts as they learn the new interface rules.
Establishing a corporate Center of Excellence (CoE) helps centralize ongoing workspace governance, provides approved dashboard templates, and delivers tailored training tracks to match the varying analytical needs of different business units.
Accelerating the Transition via Pulse Convert
For large global enterprises operating thousands of distinct production reports, executing a migration using purely manual development workflows presents severe operational bottlenecks. Forcing engineering teams to manually reconstruct every visual element, re-type hundreds of intricate calculation paths, and re-establish data source pathways by hand requires months of repetitive labor. This manual approach frequently delays migration schedules, expands project budgets, and creates friction with business stakeholders who need continuous access to business-critical insights.
Unlocking Efficiency with Pulse Convert and 75 to 90% Automated Accuracy
To eliminate these development bottlenecks, forward-looking enterprise technology leaders are adopting advanced Power BI migration automation solutions. Our proprietary conversion engine, Pulse Convert, offers a direct answer to manual transition friction. By automatically scanning the underlying XML architecture, workbook logic, and data configurations of legacy files, Pulse Convert delivers an impressive 75 to 90% automated accuracy when migrating structural business logic directly into the target platform's format.
Integrating automated software conversion tools changes the entire timeline and financial profile of an enterprise business intelligence migration. Instead of spending valuable time on repetitive layout duplication and manual calculation debugging, your senior data engineering resources can focus on advanced performance tuning, complex semantic modeling, and corporate data governance. Deploying an automated approach with Pulse Convert keeps your project on schedule, minimizes business disruption, and allows your enterprise to realize the cost-saving benefits of a modern analytics ecosystem, a process explored in our complete guide enterprise Tableau to Power BI migration.
To evaluate how our automated modernization engine can accelerate your corporate technology transition, explore our dedicated data migration offerings. If you are ready to test our automated translation software with your own production workbooks, visit the Microsoft commercial marketplace to start your free trial. To schedule a custom portfolio mapping assessment or to discuss your architectural roadmap with our engineering team, please contact us directly to build your deployment plan.


