Breaking the Visualization Silo: The Enterprise Structural Blueprint to Successfully Convert Tableau to Power BI
 0|
0| 0
0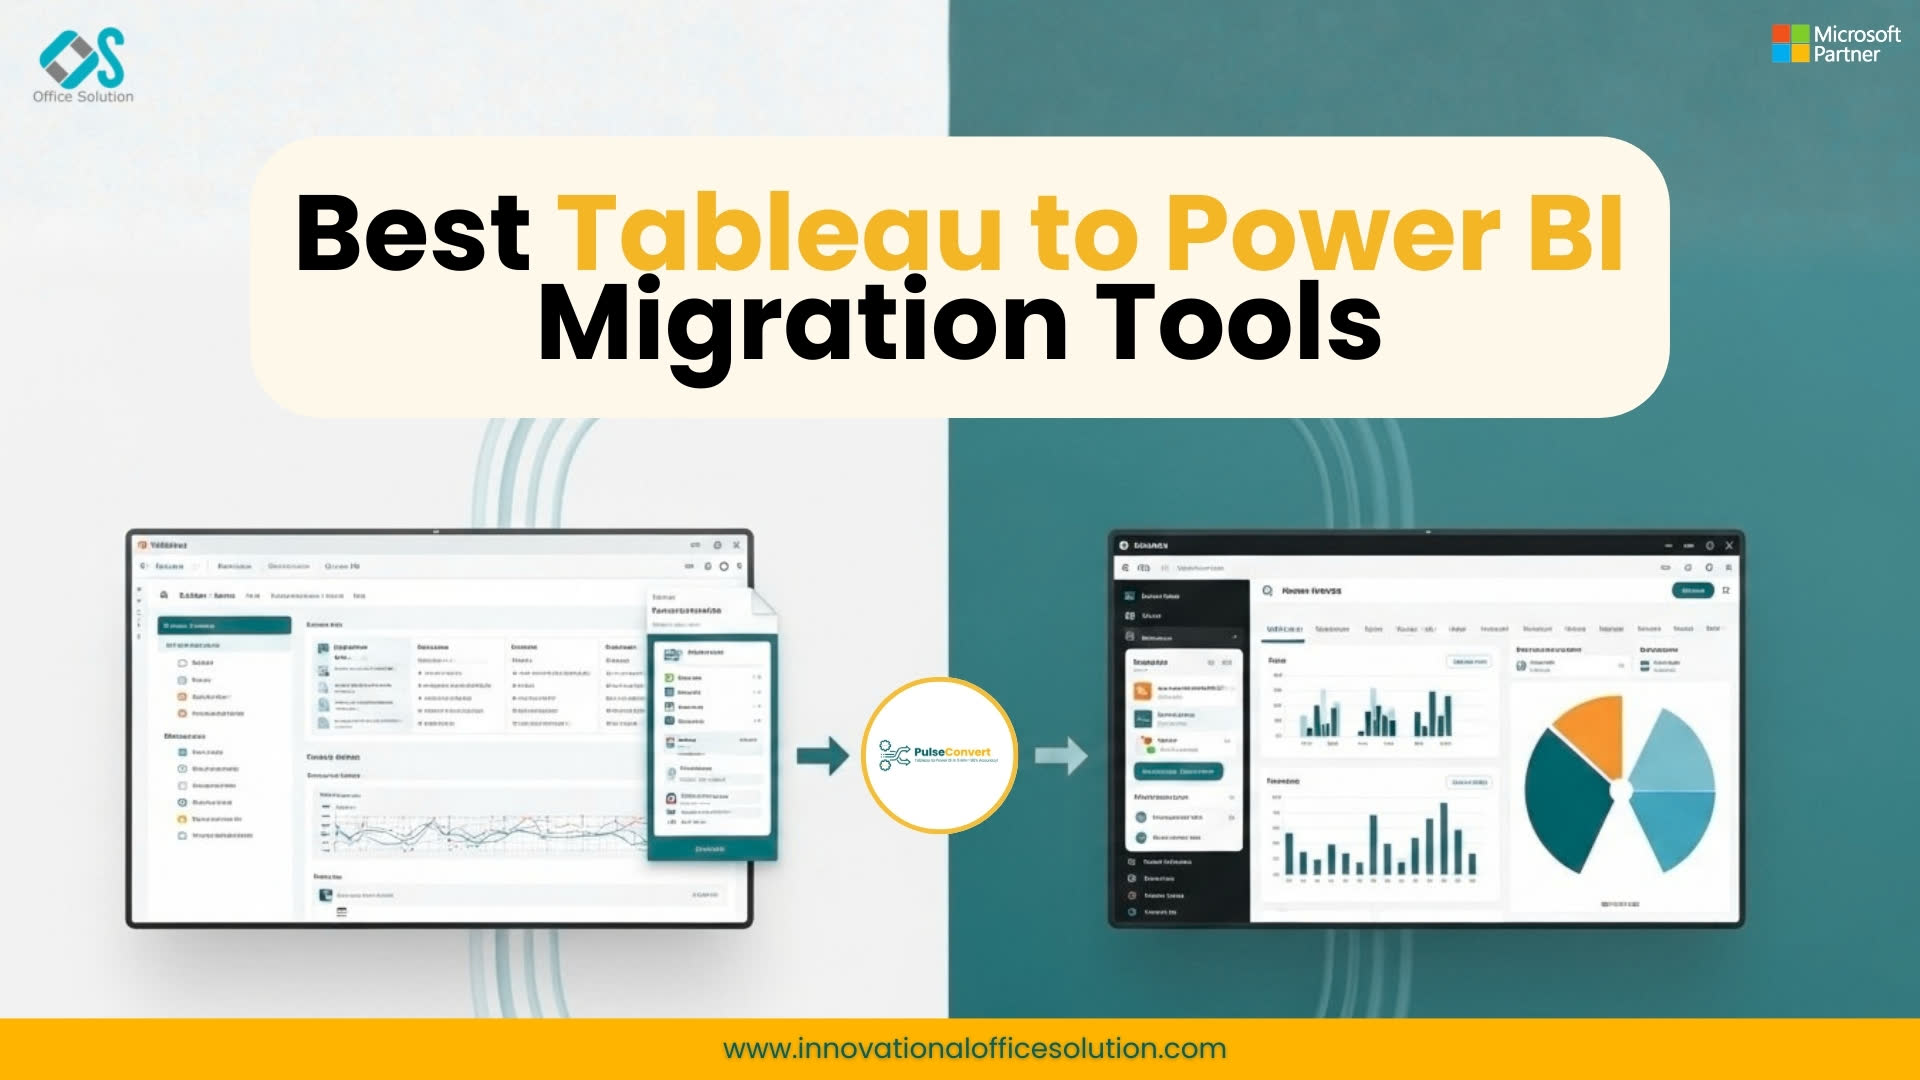
Table of Contents
The Architectural Mandate: Redefining Modern Analytics Infrastructure
Modern corporate data landscapes have reached an inflection point where decentralization no longer yields operational agility. Over the past decade, rapid departmental expansion led many global organizations to adopt disparate business intelligence environments, leaving individual divisions to construct siloed analytical sandboxes. This fragmentation created massive operational friction, characterized by escalating software licensing overhead, isolated database connection strings, and completely mismatched definitions of core operational metrics. As major corporations look to maximize their return on technology investments, standardizing the enterprise reporting stack within unified cloud analytics structures has transformed from an IT cost-saving goal into a critical competitive necessity.
Executing a comprehensive enterprise Tableau to Power BI migration involves far more than simply rebuilding legacy charts on a new canvas. It represents a fundamental architectural shift from a presentation-centric visualization model to an enterprise-grade, model-first semantic framework. In a visual-centric legacy environment, calculations, data transformations, and custom user filters are frequently hardcoded directly into individual sheets and workbooks, making centralized governance nearly impossible. Transitioning your entire corporate ecosystem to a unified framework demands a disciplined engineering methodology that separates raw underlying data connectivity from visual presentation layers, establishing a singular, immutable source of truth for the entire company.
Successfully navigating this operational pivot requires complete alignment between enterprise data architects, infrastructure teams, and executive stakeholders. Treating this transition as a simple clerical task inevitably leads to project delays, broken pipelines, and major layout latency. By approaching this structural evolution with the same strict governance applied to production software engineering, organizations can dismantle legacy reporting silos, lower total cost of ownership, and ensure that their analytics infrastructure remains highly performant while handling hundreds of millions of transactional records.
Technical Deconstruction: Navigating the Incompatibility of BI Calculation Engines
The primary technical challenge encountered when an enterprise attempts to convert Tableau to Power BI lies in the absolute divergence of their underlying computational engines. The legacy system relies heavily on a calculation framework optimized to evaluate dimensions and facts on the fly based entirely on the specific configuration of rows, columns, and marks present on a visual worksheet. This flexible design empowers ad-hoc visualization development but creates extensive maintenance friction when scaling across global business units. In sharp contrast, the target modern ecosystem operates on a highly disciplined relational structure powered by Data Analysis Expressions (DAX), a functional language explicitly engineered to traverse complex data models using dynamic row and filter contexts.
Because of this profound structural incompatibility, a straightforward, text-to-text translation of calculated fields is technically impossible. For instance, legacy level-of-detail (LOD) expressions that isolate calculations across specified dimensional bounds must be entirely re-engineered. Data developers must systematically deconstruct these expressions and rewrite them into optimized DAX using functions such as CALCULATE, FILTER, ALLEXCEPT, and SUMMARIZE to enforce the exact same operational boundaries. Failing to accurately account for the subtle differences in filter propagation between these two calculation engines will lead to critical calculation errors and destroy user trust in the new platform.
Furthermore, the structural handling of underlying data relationships requires an intensive, server-side data normalization process. Legacy workbooks frequently utilize ad-hoc data blending and custom, unindexed SQL strings to join disconnected database tables within the visual interface, which can cause significant performance slowdowns when data scale increases. The modern target ecosystem achieves peak performance exclusively when data sources are organized into a clean star-schema design, where central, thin transactional fact tables link directly to independent descriptive dimension tables. Consequently, corporate engineering teams must prioritize upstream data curation and database-level optimization to ensure the new cloud semantic models remain lightning-fast during peak business hours.
The Strategic Assessment Framework: Rationalizing the Corporate Report Estate
A common, incredibly costly mistake during large-scale business intelligence transformations is the unexamined decision to migrate every single historical workbook. Over years of active operation, enterprise data environments naturally collect massive amounts of data waste, including abandoned development sandboxes, duplicate report variations, and outdated dashboards that are completely unread by corporate leadership. Beginning a technical migration without executing a comprehensive inventory cleanup will cause organizations to waste hundreds of thousands of dollars in engineering hours migrating reports that provide absolutely zero business value.
To protect engineering resources, project managers must implement a rigorous asset discovery and rationalization workflow using automated server-side usage metadata. By pulling comprehensive audit logs directly from your reporting server, data leads can precisely map report engagement, pinpoint zero-use dashboards, and formally retire dead assets from the active development pipeline. This evaluation phase divides the validated corporate report inventory into clear execution paths:
- Decommission: Purge completely unread or redundant workbooks.
- Consolidate: Merge highly overlapping department views into a single, comprehensive semantic model.
- Migrate: Promote highly critical operational dashboards to the automated modernization track.
Once the active report estate is fully optimized, developers must document a thorough technical schema for every validated asset. This technical blueprint must list every database connection string, underlying cloud repository path, query dependency, and embedded calculation rule tied to each workbook. Gathering these configuration details before beginning development permanently eliminates broken pipeline connections, reduces deployment downtime, and gives the engineering team a clean, standardized blueprint to reference throughout the construction cycle.
Introducing Pulse Convert
The definitive bottleneck preventing large-scale corporate data modernizations has always been the immense volume of manual developer hours required to reconstruct sophisticated reporting setups from scratch. Enterprise data professionals historically had to spend weeks manually dissecting legacy workbook properties, mapping complex visual layouts, and painstakingly typing identical formula rules line by line into a new developer tool, driving up consulting expenses and stretching out deployment timelines. To eliminate this manual friction, modern data infrastructure teams leverage Pulse Convert, a highly specialized, enterprise-grade BI migration automation tool developed by Office Solution AI Labs.
Operating as an advanced automated BI conversion platform, Pulse Convert completely bypasses manual redevelopment by directly reading and parsing the underlying XML code of legacy workbook files (.twb and .twbx). The automated BI conversion platform instantly extracts visual layouts, filter parameters, and relational connections, translating complex source formulas into optimized DAX measures with an extraordinary 75% to 90% automated accuracy. This cutting-edge BI migration automation tool handles the heavy lifting of structural schema translation in under five minutes, reducing months of development risk down to minutes of automated processing. Corporate technology leaders can test this high-fidelity transformation system on their own production dashboards by utilizing a free trial, which provides an accelerated engineering path that leaves developers to focus exclusively on minor post-migration polishing and user acceptance validation.
Deployment Mechanics: Execution Lifecycles and Production Staging
Executing a reliable transition across complex multinational corporations requires a highly organized, milestone-driven execution playbook. Attempting a broad, ad-hoc rollout across all corporate divisions simultaneously strains infrastructure resources and introduces unnecessary operational risks. Instead, the migration process must be deployed through a series of structured milestones designed to preserve system uptime and ensure that your teams always have uninterrupted access to critical historical metrics.
Tenant Architecture and Security Gateways
The initial phase focuses entirely on preparing the modern target cloud tenant and establishing secure enterprise data gateway connections. Engineers must configure access settings across cloud storage layers, relational databases, and on-premises data warehouses. Implementing robust transport-layer encryption across all active pipelines ensures complete compliance with global corporate privacy standards right from day one.
Star-Schema Semantic Reconstruction
Next, technical leads normalize raw, unorganized source queries into clean, performant relational data tables. This step involves explicitly setting field formats, creating uniform date tables, and setting up efficient incremental refresh rules. Proper configuration here prevents query timeouts and shields source operational databases from performance degradation during high-traffic business reporting cycles.
Automated Logic Parsing via Pulse Convert
With the data layer securely staged, developers pass legacy workbooks through the automated conversion engine. Pulse Convert automatically parses the source metadata, builds the baseline visual layouts, and translates calculation modules directly into organized DAX syntax. This automation slashes core engineering time, giving developers a structured, pre-built template to refine.
UI Fidelity and Interactive Cross-Filtering
Designers now take over the automated template to refine user interface alignments and build intuitive interactive filtering paths. Rather than trying to rebuild old charts down to the exact pixel, the design focus should center on using native visual features to maximize layout responsiveness and simplify executive navigation.
Production Deployment and Directory Synchronization
The final milestone involves promoting verified reports into official workspace apps and connecting row-level data access permissions to central directory tools like Microsoft Entra ID. This absolute automation ensures that user access privileges scale dynamically with employee roles, safeguarding sensitive enterprise data assets globally.
Quality Assurance: Designing Robust Dual-System Validation Frameworks
A successful data modernization project demands an exhaustive, multi-layered data reconciliation process before moving to production. Even when using highly accurate automated conversion platforms, engineering teams cannot bypass strict quality checkpoints. If an executive uncovers even a slight discrepancy between historical financial metrics and the new reporting application, corporate trust in the entire modernization program will immediately collapse.
To mitigate this risk, data teams must run parallel testing pipelines where identical operational parameters are evaluated across both the legacy and modern platforms simultaneously. Quality assurance specialists must check that row counts match perfectly, analyze edge-case variances across extended historical time horizons, and ensure that dynamic parameter filters behave identically under extreme conditions. This thorough evaluation guarantees absolute numerical continuity across every single operational branch.
Beyond validating backend calculations, structured user acceptance testing (UAT) is an absolute necessity to ensure rapid change management and long-term user adoption. Key business analysts and department managers must be brought into a dedicated staging sandbox to evaluate the interface early in the project timeline. Collecting this direct feedback allows developers to fix minor layout issues, refine specialized filtering behaviors, and ensure that the final layout matches real-world corporate needs perfectly, giving business units absolute confidence in their modern analytics platform.
Platform Governance: Establishing Long-Term Cloud Security Models
Moving your enterprise reporting assets to a unified cloud ecosystem requires an unyielding commitment to continuous platform governance. Without a strict administrative framework, even the most advanced data platforms can quickly become cluttered with ad-hoc test datasets and uncertified, poorly written report variations. Database administrators must establish a formal development lifecycle that separates distinct creation, staging, and production environments, ensuring that no modifications are ever deployed to executive teams without undergoing extensive testing.
Security controls must be coded directly into the shared semantic model layer rather than being applied as fragile configurations on individual visual components. Data engineers must carefully map old user group rules to secure, server-side Row-Level Security (RLS) filters within the cloud ecosystem. Integrating these data roles with your company's central identity directory ensure that when an employee switches teams or exits the organization, their report viewing privileges update automatically, eliminating security vulnerabilities and preventing unauthorized data access.
Furthermore, enterprise governance must explicitly address global data residency rules and cloud tenant capacity limits. As analytics scale across international operations, certain data protection regulations strictly limit where physical financial or consumer profiles can be processed. Enterprise administrators must deploy targeted premium capacities across specific physical cloud regions to meet local data compliance laws while keeping server performance fully optimized, providing global corporate networks with a thoroughly secure and incredibly scalable analytics ecosystem.
Sustaining Analytical Velocity and Maximum ROI
The ultimate success of an enterprise data transformation is measured by how effectively your corporate workforce uses the new platform to drive daily operational efficiencies. Simply building a modern, cloud-powered analytics framework yields zero commercial value if your internal business units resist the platform shift and slip back into using unmanaged local spreadsheets. Overcoming this internal friction requires a structured change management playbook that combines ongoing technical training with active organizational support.
Establishing a cross-functional center of excellence gives power users, data analysts, and corporate leaders a centralized hub to share design patterns, troubleshoot DAX optimizations, and collaborate on advanced custom metrics. This collaborative network breaks down old departmental silos and empowers business units to continuously improve their own analytics assets. Providing specialized training tracks tailored to specific technical skill levels ensures that every employee—from front-line supervisors to C-suite executives—can confidently navigate the new platform to extract actionable business insights.
Finally, platform administrators must implement continuous cloud capacity monitoring to keep infrastructure costs highly predictable. IT teams should run regular audit scripts to locate unused dashboards, tune poorly written queries that trigger server resource bottlenecks, and adjust partition strategies to ensure lightning-fast performance during critical monthly planning sessions. By combining intelligent automation tools with disciplined administrative oversight, global enterprises can maximize the return on their modern cloud investments, protect critical data integrity, and turn their consolidated business intelligence ecosystem into a powerful driver of long-term commercial growth.
Verified Technical Document Directories
- For a definitive overview of enterprise transition strategies, consult the tableau to power bi migration 2026 guide.
- To learn step-by-step development rules for modernizing systems, review the comprehensive guide using tableau to power bi migration.
- For an exhaustive evaluation of platform features and differences, read the tableau vs power bi 2026 comparison.
- For a deep architectural breakdown of modern semantic modeling, review the complete guide enterprise tableau to power bi migration.
- To avoid common calculation logic errors during large-scale updates, read the tableau to power bi migration comprehensive technical guide 2026.
- To connect directly with senior data engineering specialists and map out a custom modernization strategy, please contact us immediately.
Frequently Asked Questions (FAQs)
1. How long does a full enterprise Tableau to Power BI migration typically take?
The timeline of an enterprise migration depends heavily on the size of the report estate and the level of automated tool integration. A traditional, fully manual redevelopment project can drag on for several months or even years for portfolios with hundreds of reports. However, by leveraging an automated BI conversion platform like Pulse Convert, the core visual and calculation translation phase is cut down to minutes, allowing organizations to complete large-scale transformations up to 75 to 90% faster.
2. Can an automated BI migration automation tool perfectly convert 100% of my dashboard visuals?
No migration tool provides 100% automated conversion out of the box due to fundamental software design differences and proprietary visual types unique to each platform. Pulse Convert achieves an initial conversion accuracy of 75% to 90%, automatically translating core data models, filter mechanisms, and complex calculation fields into optimized DAX measures. The remaining 12% to 25% represents unique visualization types or specialized custom formatting that developers can quickly fine-tune manually.
3. How does the migration process handle complex Tableau Level of Detail (LOD) calculations?
Tableau LOD expressions isolate data metrics across specified dimensions independently of the active visual layout. During an automated migration via Pulse Convert, these expressions are automatically mapped and converted into performant DAX equations using functions like CALCULATE, ALLEXCEPT, and SUMMARIZE. This automated engineering ensures complete data consistency while maximizing the speed of the underlying column-store database engine.
4. What are the primary license cost benefits when migrating to the Microsoft Fabric ecosystem?
Enterprises moving away from legacy analytics setups frequently experience a massive reduction in total cost of ownership (TCO). Rather than buying expensive, individual user creator licenses for every single data consumer, standardizing on Power BI and Microsoft Fabric allows companies to utilize shared corporate capacities. This licensing flexibility enables unconstrained report sharing across tens of thousands of global employees while keeping IT infrastructure costs entirely predictable.
5. How is row-level data security maintained during the platform transition?
Data security profiles are lifted out of individual presentation layers and built directly into the foundational semantic model using cloud-hosted Row-Level Security (RLS) rules. These secure definitions link directly with central company directory systems like Microsoft Entra ID. This absolute automation means that when a user changes departments or leaves the company, their data view permissions update instantly, preserving total regulatory compliance across all business groups.


