Enterprise Tableau to Power BI Migration Framework: Strategic Comparison, Architecture, and Execution Roadmap
 0|
0| 0
0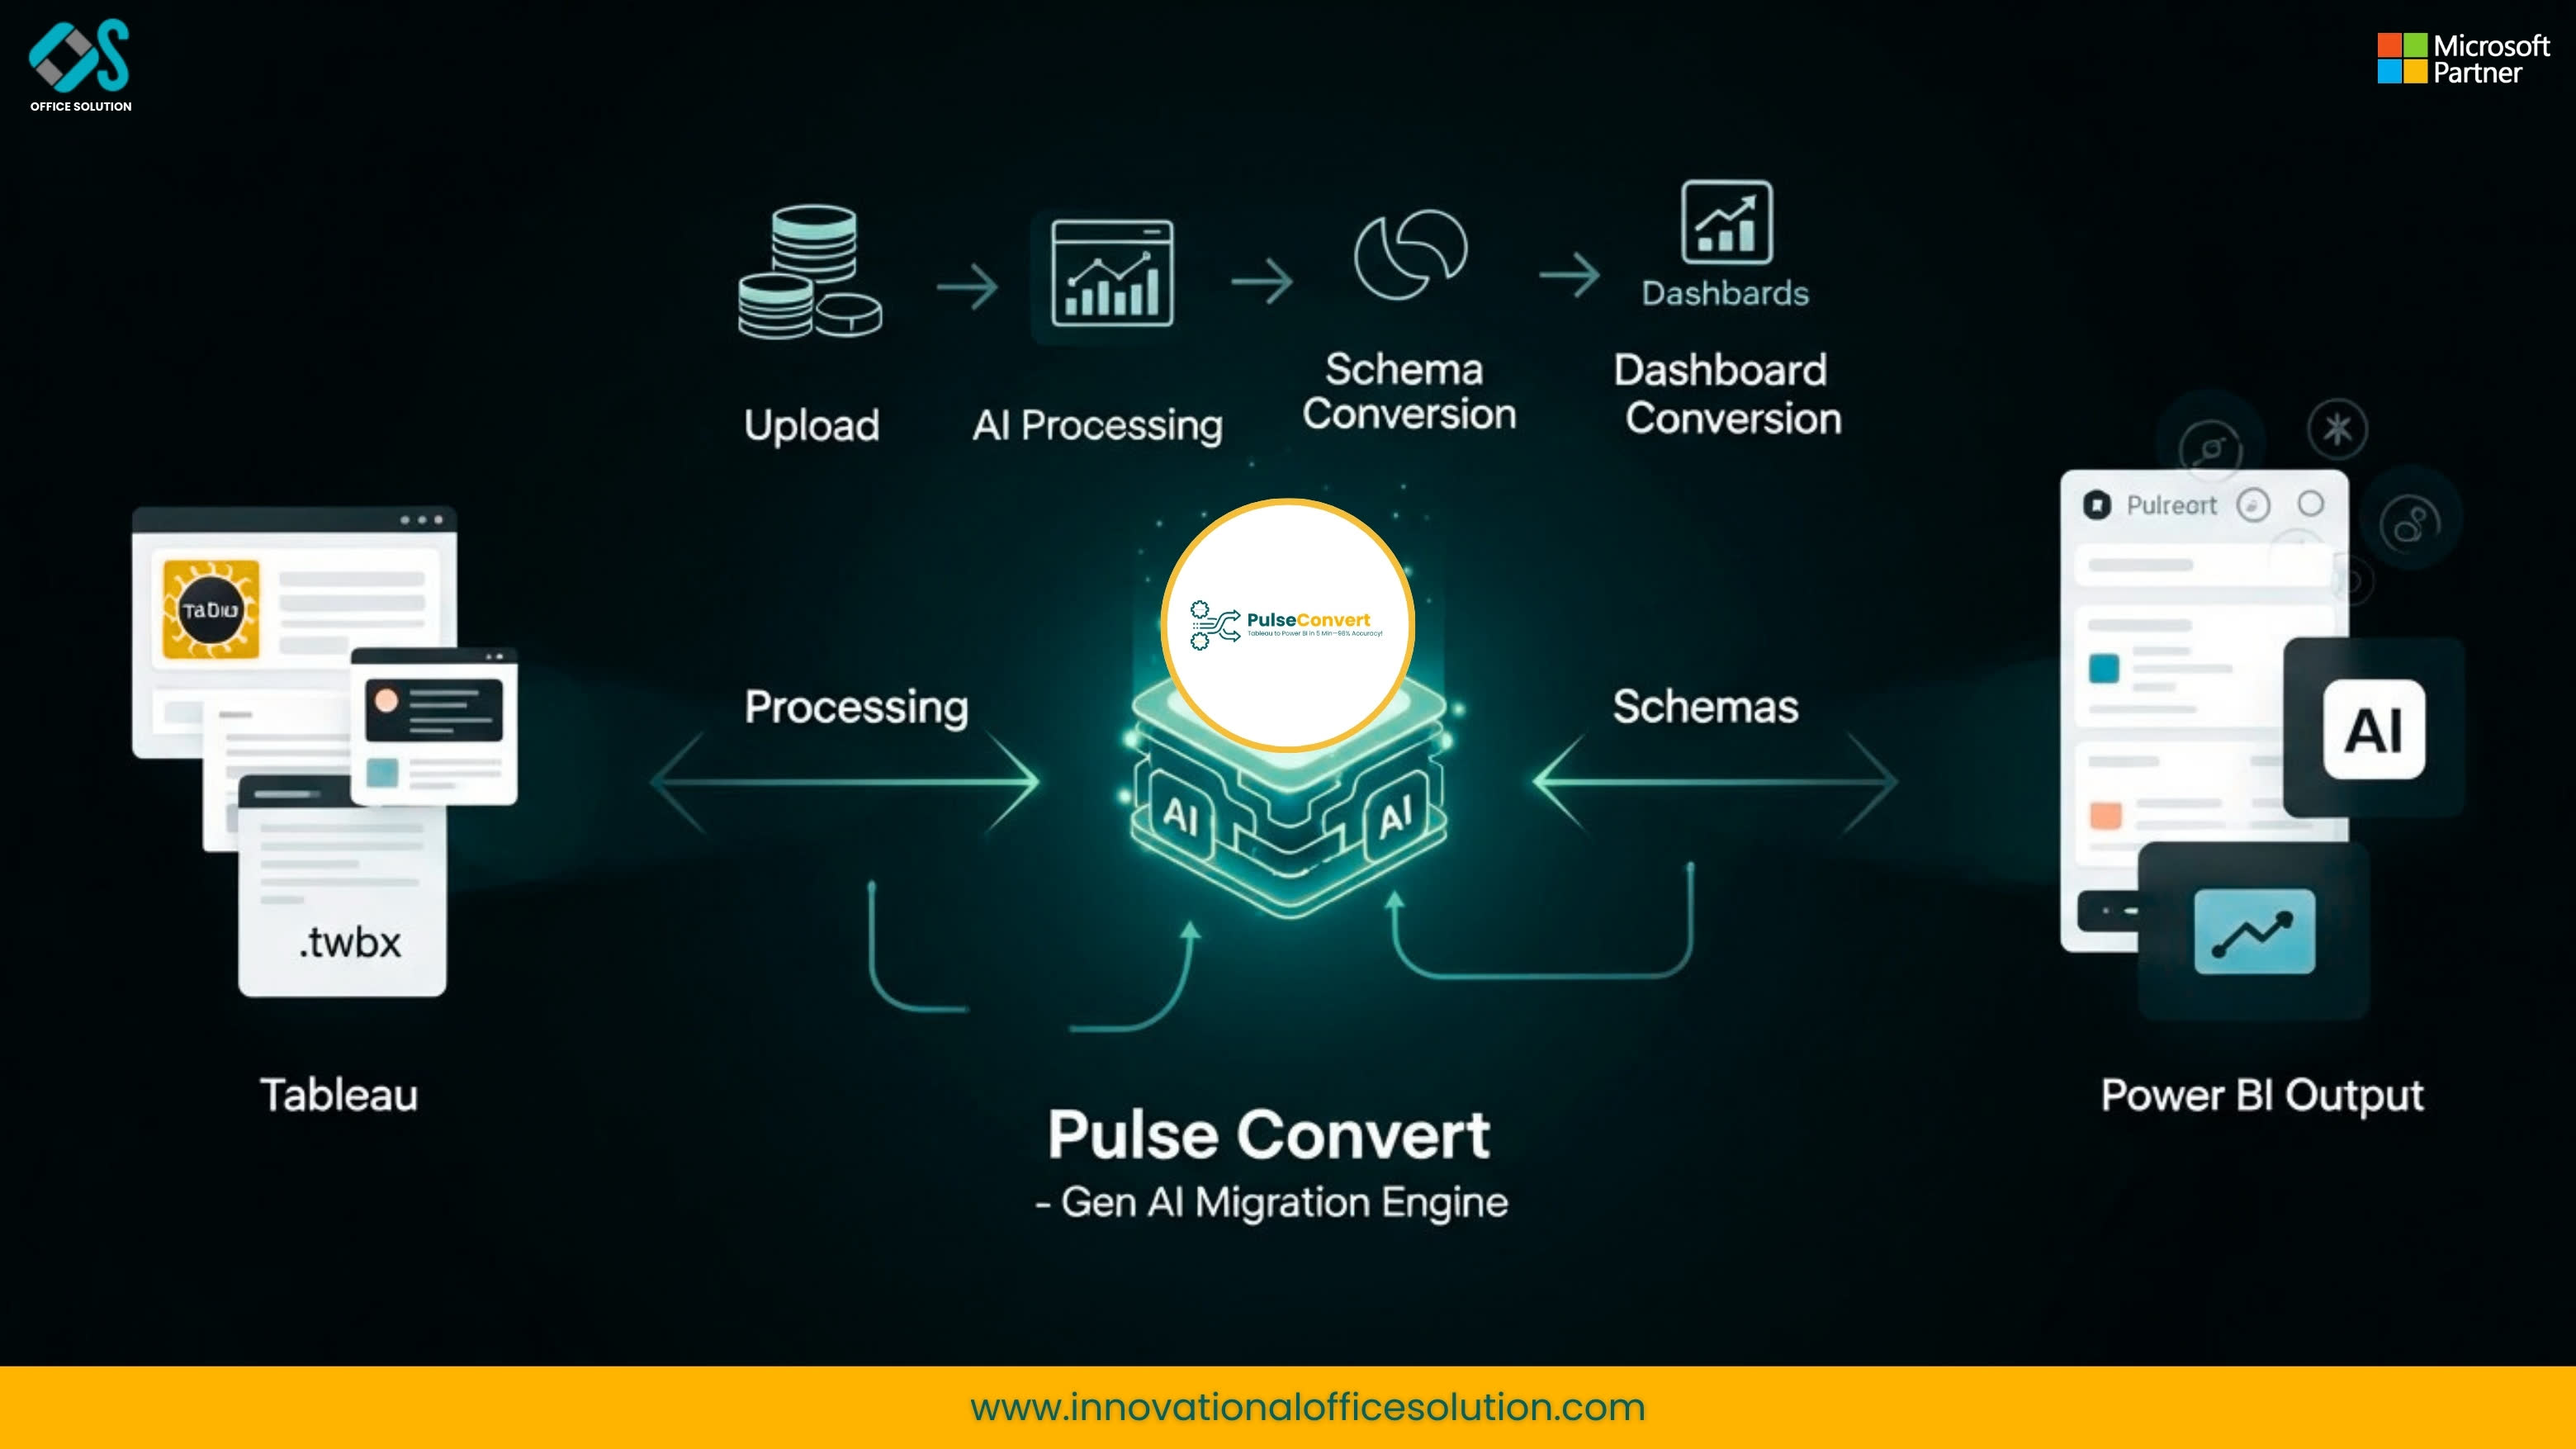
Table of Contents
Executive Summary: The Modern Business Intelligence Landscape
The enterprise analytics landscape is undergoing a significant architectural consolidation. For over a decade, standalone visual discovery software was the primary choice for data exploration and executive reporting. However, as organizations in both global enterprise markets and digital technology hubs expand their data lakehouses, streamline cloud costs, and embrace artificial intelligence, technology leaders are re-evaluating their reporting stacks. This shift has placed the project to migrate from Tableau to Power BI at the top of the agenda for Chief Information Officers, Data Architects, and Business Intelligence Leads.
When enterprise leaders evaluate tableau vs power bi, the conversation is rarely limited to chart aesthetics or drag-and-drop dashboard design. Instead, decision-makers are weighing long-term total cost of ownership (TCO), cloud data warehouse compatibility, row-level security governance, and native integration with AI frameworks like Microsoft Copilot and Azure OpenAI. Choosing to convert Tableau to Power BI allows organizations to consolidate fragmented data models into centralized semantic layers, drastically reducing licensing overhead while expanding self-service analytics across the entire enterprise.
Executing a successful Tableau to Power BI migration requires far more than manually re-creating visuals chart by chart. Without a structured Tableau to Power BI migration approach, engineering teams risk transferring technical debt, creating metric discrepancies between business units, and causing operational friction during cutover periods. This comprehensive guide breaks down the core difference between tableau and power bi, explores the strategic drivers behind platform consolidation, and outlines an enterprise-grade roadmap for a zero-downtime migration from Tableau to Power BI.
Strategic Comparison: Tableau Software vs Power BI
Understanding why companies choose to migrate from Tableau to Power BI begins with an objective look at tableau software vs power bi. Both tools represent mature, enterprise-grade business intelligence solutions, but they were built on fundamentally different architectural philosophies.
1. Total Cost of Ownership and Licensing
The primary economic catalyst driving Tableau to Power BI migration is total cost of ownership. Tableau software relies on a per-user licensing model split across Creator, Explorer, and Viewer roles. For large organizations with thousands of business users across the USA and India, this pricing structure can lead to escalating annual software expenses.
Conversely, Power BI leverages per-user licensing (Power BI Pro/Premium) or capacity-based licensing through Microsoft Fabric units (F-SKUs). Because many enterprises already possess Microsoft 365 E5 agreements, deploying Power BI often requires minimal additional software outlay. Organizations transitioning their reporting stack frequently realize licensing cost reductions between 60% to 75%, allowing IT departments to reallocate capital toward advanced data lakehouse engineering and AI initiatives.
2. Semantic Modeling vs Worksheet Calculations
A key diff between tableau and power bi lies in where business logic resides. In Tableau software, calculation logic, Level of Detail (LOD) expressions, and data blends are often embedded directly within individual worksheets and workbooks. This decentralized model encourages fast ad-hoc visual discovery, but it frequently leads to "Shadow BI"—a scenario where different departments publish conflicting definitions for identical business metrics.
In contrast, Power BI enforces a "Model-First" architecture. Business logic is developed within a centralized, enterprise-wide Power BI Semantic Model using Data Analysis Expressions (DAX) and Power Query (M). Once published, multiple downstream reports connect to this single certified dataset. This structural approach guarantees that financial metrics, sales KPIs, and supply chain totals remain mathematically identical regardless of who builds the dashboard.
3. AI Capabilities and Ecosystem Integration
In the current analytics environment, generative AI integration is a major factor when evaluating tableau power bi capabilities. Power BI is natively integrated into Microsoft Fabric, Azure, and Microsoft 365 apps like Teams, Excel, and PowerPoint. Through Copilot, users can generate complex DAX measures using plain-English prompts, create report pages automatically, and receive automated narrative summaries. While Tableau offers Tableau Pulse and Einstein features within the Salesforce cloud, Power BI's deep alignment with enterprise Microsoft productivity tools provides a more unified workflow for business users.
Key Drivers to Migrate from Tableau to Power BI
Enterprise data teams face mounting pressure to simplify reporting infrastructure, eliminate redundant data pipelines, and improve metric governance. When evaluating a Tableau to Power BI transition, business leaders highlight four primary catalysts:
- Elimination of Data Silos: Isolated Tableau software server workbooks frequently duplicate underlying database queries and store fragmented extracts. Transitioning to a unified tableau power bi framework centralizes data access through single-source semantic datasets.
- Simplified Identity and Security Governance: Managing permissions across separate Tableau Server or Cloud environments creates security overhead. Power BI integrates directly with Microsoft Entra ID (formerly Azure Active Directory) and Microsoft Purview, enforcing Row-Level Security (RLS) and Object-Level Security (OLS) across all reports automatically.
- High-Performance Cloud Connectivity: Modern cloud data lakehouses like Snowflake, Databricks, and Azure Synapse perform exceptionally well with Power BI's DirectQuery and Direct Lake modes. This eliminates the need to schedule and maintain heavy proprietary data extracts.
- Talent Availability and Ease of Adoption: Because Power BI shares UI patterns and DAX logic with Microsoft Excel, business analysts transition rapidly. The global pool of certified Power BI developers in regions like India and North America makes talent acquisition straightforward and cost-effective.
Introducing Pulse Convert for Automated Conversion
One of the most daunting operational hurdles during any Tableau to Power BI migration is the manual effort needed to reconstruct legacy workbooks. Manually rewriting hundreds of calculated fields, re-mapping visual coordinates, and re-establishing database connections can stall IT projects for months and introduce calculation errors into executive reporting.
To solve this challenge, Office Solution AI Labs developed Pulse Convert, an enterprise migration engine designed to automate workbook conversion. Introducing Pulse Convert into your modernization workflow replaces tedious manual rebuilding with an automated transformation pipeline. Pulse Convert programmatically parses legacy Tableau XML structures, extracts embedded calculations, maps visual canvas coordinates, and outputs native Power BI files (.pbix) and semantic datasets.
By utilizing advanced pattern recognition and automated DAX translation algorithms, Pulse Convert delivers an automated accuracy rate of 75% to 90% across standard workbooks, complex calculated fields, parameters, and visual layouts. This high level of automation reduces overall project delivery timelines by up to 60%, slashes conversion costs, and allows data engineers to focus on performance tuning and security configuration rather than manual chart drawing. To learn how this technology can accelerate your platform modernization, explore the capabilities available at Office Solution AI Labs.
Selecting the Right Tableau to Power BI Migration Approach
Executing a successful migration from Tableau to Power BI requires picking an engineering methodology that aligns with your organization's technical maturity and report volume. A common mistake is attempting a quick "lift-and-shift"—copying outdated charts directly into Power BI without updating the underlying data model.
To ensure long-term success, enterprise data architects recommend evaluating three primary approaches:
Approach 1: The "Semantic Layer First" Architectural Strategy
The most effective Tableau to Power BI migration approach prioritizes decoupling data modeling from visual dashboard construction. As detailed in cloud architecture guidelines published on the Microsoft Tech Community, architects should consolidate raw database tables, star schemas, and business formulas into a centralized semantic dataset first. Once this shared semantic layer is certified, individual business units connect their Power BI report canvases directly to the published dataset, ensuring consistent metrics across the company.
Approach 2: Phased Departmental Rollout
For large enterprises managing hundreds of active dashboards, a single-day cutover introduces unnecessary operational risk. A phased departmental rollout divides the migration backlog by business unit (e.g., Finance and Accounting in Phase 1, followed by Operations, Sales, and HR). Each phase involves auditing existing dashboards, automated conversion through Pulse Convert, User Acceptance Testing (UAT), and user training before retiring legacy dashboards.
Approach 3: Automated Conversion with Hybrid Engineering
This methodology combines automated translation tools with expert engineering review. Pulse Convert is deployed to handle 75% to 90% of the conversion workload automatically, generating foundational Power BI report files. BI engineers then review the output, optimize DAX formulas using performance tuning tools, and add native Power BI features like Decomposition Trees and field parameters.
Technical Deep-Dive: Translating Logic Between Platforms
Engineers managing a project to convert Tableau to Power BI must navigate key technical differences between the two engines. While both platforms deliver interactive visual analytics, their underlying calculation engines and data handling mechanisms differ significantly.
Translating Level of Detail (LOD) Expressions to DAX
In Tableau software, developers control calculation granularity using Level of Detail expressions (FIXED, INCLUDE, EXCLUDE). These expressions compute values at specific dimensional levels regardless of the filters applied on the visual canvas.
In Power BI, context is managed through the DAX filter context and row context. Converting an LOD expression requires mapping FIXED calculations to DAX patterns that combine CALCULATE with filter-modifying functions like ALL, ALLEXCEPT, or REMOVEFILTERS. For example, a fixed regional calculation in Tableau translates into a DAX measure that explicitly overrides ambient page filters. Pulse Convert automates the vast majority of these formula conversions, removing manual guesswork for developers.
Data Blending vs Relational Star Schema Modeling
Legacy workbooks often rely on client-side "Data Blending" to join separate data sources at the worksheet level. While flexible for quick analysis, data blending frequently causes performance bottlenecks and unexpected null values as data volumes grow.
When you migrate from Tableau to Power BI, data blending should be replaced with a relational star schema. In Power BI, fact tables and dimension tables are joined through clear relationships evaluated within Power BI's high-performance memory engine (VertiPaq), delivering rapid query results across millions of rows.
Parameters, Actions, and Navigation
Both tools support dynamic interactivity, but their user interface controls vary:
- Filters and Actions: Tableau uses context filters, sheet highlight actions, and URL parameters. Power BI controls interactivity through visual slicers, cross-filtering rules, page-level filters, and sync-slicers across multiple report pages.
- Dynamic Views: Switching between metrics in legacy tools often requires complex sheet-swapping parameter setups. Power BI implements this natively using Field Parameters, dynamic DAX measures, or bookmark state toggles.
Step-by-Step Execution Plan to Convert Tableau to Power BI
Step 1: Workbook Audit and Inventory Rationalization
Before converting any files, perform a complete audit of your reporting repository. Connect to server metadata to identify active workbooks, view counts, and data source dependencies. Categorize reports into four clear action groups:
- Retire: Eliminate unused or abandoned workbooks (typically 30% to 40% of legacy reports).
- Consolidate: Merge redundant departmental dashboards into a single interactive Power BI report.
- Re-architect: Redesign poorly performing workbooks that require backend data warehouse restructuring.
- Migrate: Convert high-value, active reports directly to Power BI.
Step 2: Data Source Configuration and Power Query ETL
Establish secure data source connections within Power BI Desktop. Custom SQL queries embedded in old workbooks should be audited and shifted toward database views or converted using Power Query (M). Power Query provides an intuitive graphical interface for data cleansing, unpivoting columns, and defining strict data types before loading data into the Tabular engine.
Step 3: Automated Conversion Execution
Ingest prioritized legacy workbooks into Pulse Convert. The automated engine parses the XML files, translates calculation formulas into optimized DAX, maps visual canvas elements, and outputs native Power BI report templates (.pbix).
Step 4: Quality Assurance and Data Reconciliation
Quality assurance is critical to maintaining business trust during a platform transition. Conduct side-by-side reconciliation tests comparing metric outputs between old and new dashboards across identical filter settings. Use Power BI Performance Analyzer to review query execution times, making sure report pages load in under two seconds.
Step 5: User Acceptance Testing (UAT) and Training
Roll out converted reports to key business stakeholders for structured UAT. Deliver role-based training sessions helping business users understand Power BI's interactive features, personal bookmarks, mobile layouts, and automated email subscriptions.
Change Management and Enterprise Adoption Strategy
Technology upgrades are only as successful as user adoption rates. When companies migrate from Tableau to Power BI, business users accustomed to legacy user interfaces may initially resist new workflows.
To drive rapid organizational adoption across teams in North America, Europe, and Asia, implement a structured change management framework:
- Establish a BI Center of Excellence (CoE): Form a dedicated cross-functional team responsible for setting governance standards, publishing corporate design templates, and providing technical support.
- Design Role-Based Learning Paths: Create distinct training tracks for executive consumers, business analysts, and data engineers. Focus on practical tasks like cross-filtering, dynamic slicers, and exporting to Excel.
- Run Parallel Environments Temporarily: Maintain side-by-side access to legacy reports for a defined 30-day window during UAT. This gives business users complete confidence in data accuracy before legacy servers are decommissioned.
Measuring ROI and Platform Modernization Success
Completing a well-planned Tableau to Power BI migration delivers long-term benefits across the enterprise data organization:
- Direct Licensing Savings: Annual software expenses drop significantly, releasing IT budget for cloud data engineering, AI agents, and predictive modeling.
- Faster Time-to-Market: Automated tools like Pulse Convert reduce transformation timelines from quarters to weeks, delivering modern cloud reporting capabilities far faster than manual migration projects.
- Future-Proof Data Architecture: Placing a centralized semantic layer at the heart of your reporting strategy prepares your company to easily adopt future innovations in Microsoft Fabric, Azure AI, and self-service analytics.
Organizations interested in evaluating potential licensing savings, testing automated conversion performance, or launching a risk-free pilot project can access a Free Trial / Free POC directly on the Azure Marketplace. To consult directly with enterprise solution architects regarding custom technical requirements, feel free to Contact us today.
Free Trial / Free POC
Organizations seeking to evaluate their potential ROI, request a technical environment assessment, or kickstart their migration journey with a hands-on proof of concept can access a Free Trial / Free POC directly on the Azure Marketplace.
Featured In Press Releases