Enterprise Tableau to Power BI Migration: The Definitional 2026 Semantic-Layer Roadmap
 0|
0| 0
0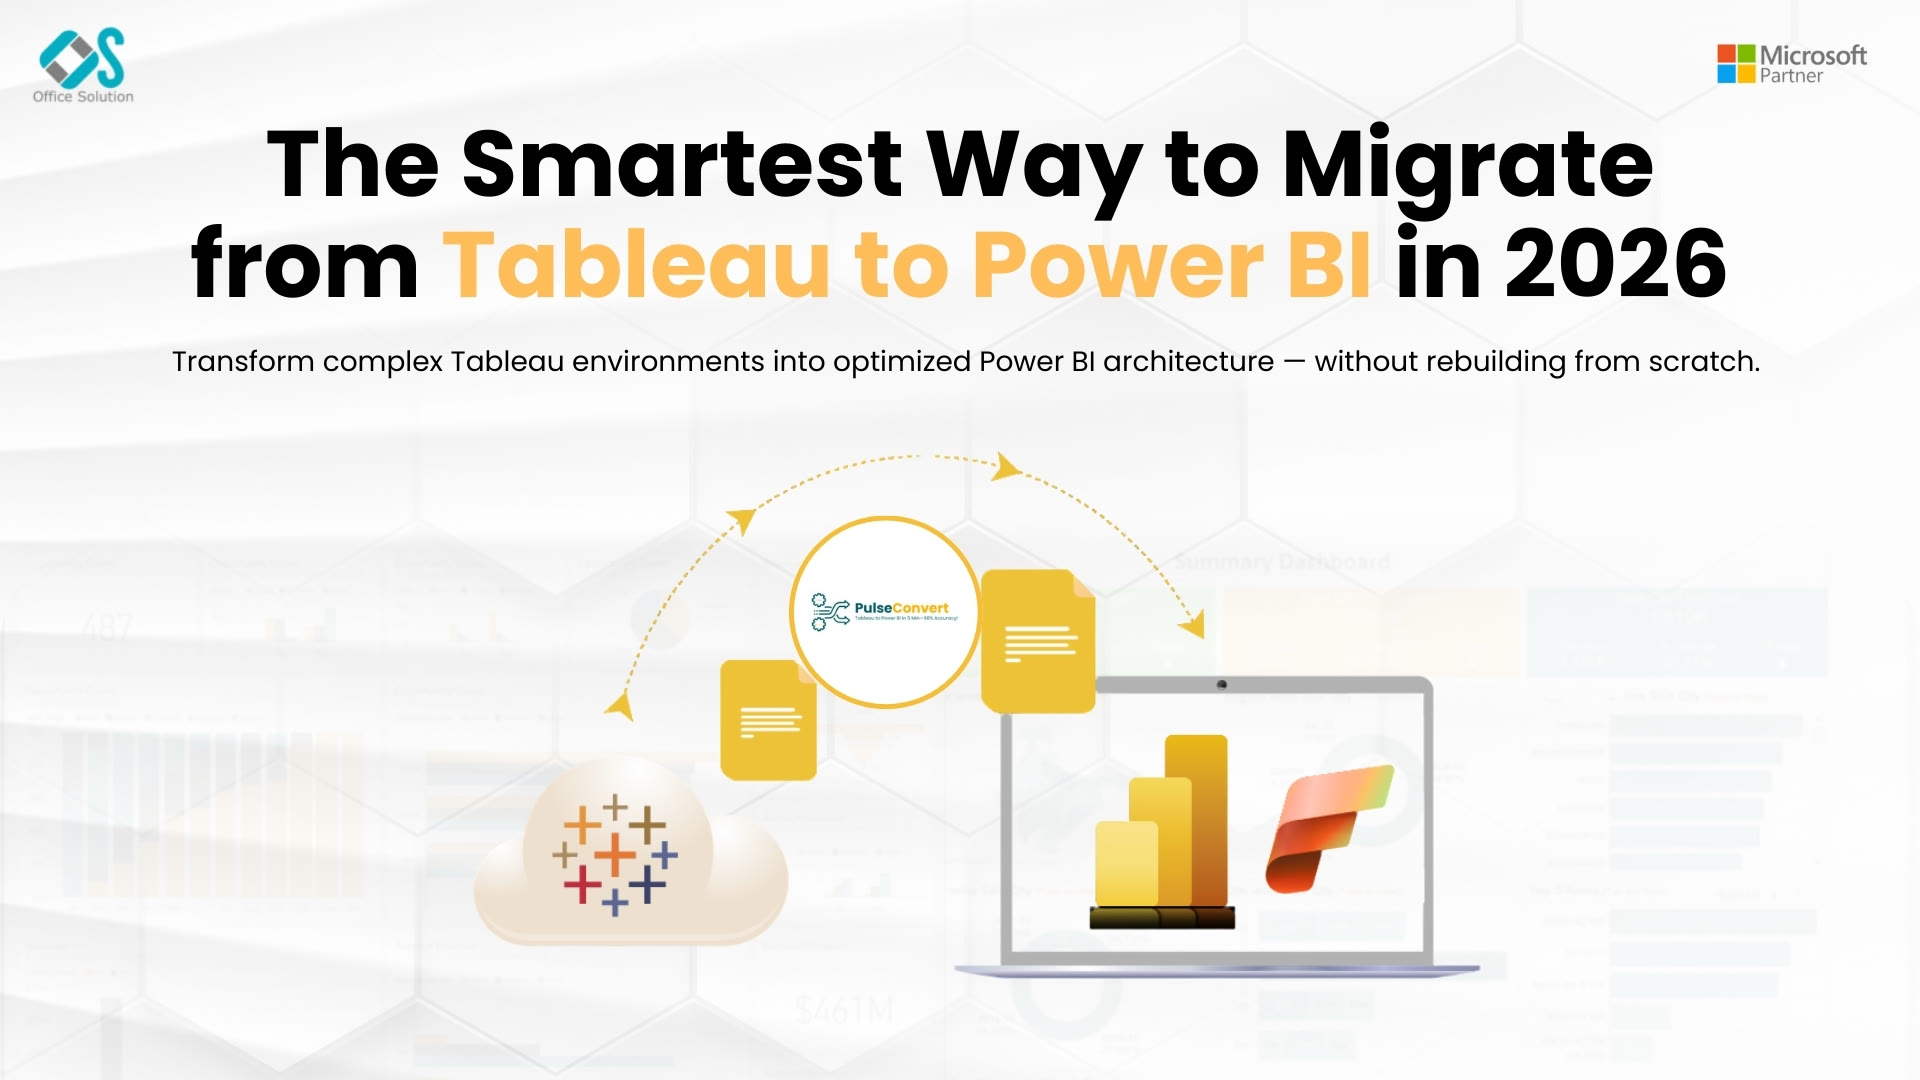
Table of Contents
Executive Summary: Transitioning Enterprise Intelligence to Power BI
Migrating business intelligence infrastructure from Tableau to Microsoft Power BI is no longer merely a licensing cost-cutting exercise; it is a strategic modernization move to centralize corporate data ecosystems. When enterprises evaluate Tableau software vs Power BI, the conversation quickly shifts from surface-level visualization capabilities to deep infrastructure integration, semantic model governance, and cloud scalability.
A successful Tableau to Power BI migration requires transforming proprietary visualization logic, Level of Detail (LOD) calculations, and complex workbook architectures into Microsoft Power BI’s native tabular data models powered by DAX (Data Analysis Expressions) and VertiPaq engine technology. Standard manual rewrites often lead to operational delays, severe financial overhead, and broken logic across enterprise dashboards.
To solve this, modern data engineering leaders rely on automated migration frameworks and semantic-layer-first methodologies. By utilizing specialized acceleration technology such as Pulse Convert by Office Solution AI Labs, enterprises can execute seamless conversions, maintain zero downtime, and achieve up to 90% automated accuracy across their entire reporting footprint.
Detailed Analysis: Tableau Software vs Power BI Architecture
Before executing a migration from Tableau to Power BI, cloud architects must understand the structural and underlying architectural difference between Tableau and Power BI. While both platforms represent elite tier-one business intelligence solutions, their internal processing engines, data models, and expression languages operate on fundamental differences.
| Feature Category | Tableau Architecture | Power BI Architecture |
|---|---|---|
| Core Analytical Engine | VizQL Engine | VertiPaq Engine |
| Primary Calculation Language | Tableau Calculation/LOD | DAX & Power Query (M) |
| Data Modeling Paradigm | Sheet-Centric / Relationships | Unified Star Schema |
| Cloud Ecosystem Integration | Independent / Salesforce | Native Microsoft 365 / Fabric |
1. VizQL vs. VertiPaq Engine Dynamics
Tableau operates on VizQL (Visual Query Language), an engine that translates drag-and-drop user actions directly into native database queries (SQL, MDX, or custom engine calls). VizQL prioritizes visual-first query generation, building data structures dynamically around individual worksheets and dashboards.
Conversely, Power BI relies on the VertiPaq in-memory columnar database engine and Analysis Services framework. Power BI enforces strict separation between data modeling (handling relationships, star schemas, and row-level security) and visual rendering. Understanding this dynamic is crucial when you convert Tableau to Power BI, as queries must shift from visual-level execution to centralized tabular model calculations.
2. Calculation Paradigms: LOD Calculations vs. DAX Measures
Tableau handles multi-granular calculations using Level of Detail (LOD) expressions (such as FIXED, INCLUDE, and EXCLUDE). These expressions allow developers to run queries at a different granularity than the visual dimension display.
In Power BI, these calculations are achieved through DAX using specialized evaluation contexts (Filter Context and Row Context) alongside context-modifying functions like CALCULATE, ALLEXCEPT, and REMOVEFILTERS. A core challenge in any Tableau to Power BI migration approach is translating nested LOD expressions into performant DAX patterns without introducing visual load latency.
The Semantic-Layer-First Tableau to Power BI Migration Approach
To execute a migration without business disruption, enterprise architects must avoid the mistake of "screen-scraping" or manually re-creating visuals one by one. Modern cloud architecture standards demand a semantic-layer-first strategy.
Step 1: Centralize Data Models Before Visuals
Instead of building individual Power BI reports for every individual Tableau sheet, extract the data sources, custom SQL scripts, join conditions, and metadata layers across your entire Tableau Server or Tableau Cloud deployment. Rebuild these connections inside Power BI as unified, reusable tabular models or Microsoft Fabric semantic models.
Step 2: Normalize Data Models into Star Schemas
Tableau allows flexible, informal data blending and multi-table relationships that can lead to performance bottlenecks if directly duplicated in Power BI. During your Tableau to Power BI migration, reshape flat tables into normalized Star Schemas comprising clean Fact tables surrounded by Dimension tables. This unlocks optimal VertiPaq columnar compression and faster DAX execution.
Step 3: Automated Logic Translation
Manually re-writing thousands of calculated fields, parameter actions, set controls, and row-level security rules from Tableau into DAX is prone to human error. Utilizing an automated engine to parse Tableau XML structural code and map it into Microsoft Power BI tabular metadata significantly accelerates this architectural phase.
Pulse Convert by Office Solution AI Labs: High-Accuracy Automated Migration
Manual dashboard conversion takes an average of 40 to 60 engineering hours per dashboard. For organizations managing hundreds or thousands of reports, a pure manual rewrite quickly becomes cost-prohibitive and introduces massive deployment delays.
| Metric | Manual Migration Rewrite | Pulse Convert Automation |
|---|---|---|
| Average Time per Report | 40 - 60 Hours | Under 30 Minutes |
| Logic Translation Error | High (Manual DAX Errors) | Near Zero (Deterministic) |
| Code Conversion Accuracy | Variable (30% - 50%) | Guaranteed 75% - 90%+ |
| Project Timeline | 12 - 18 Months | 4 - 8 Weeks |
Eliminating Manual Rewrites with Pulse Convert
Pulse Convert, developed by Office Solution AI Labs, acts as the definitive Tableau to Power BI Accelerator designed to automate the complete migration lifecycle. Pulse Convert systematically parses Tableau workbook files (.twb and .twbx format), decodes the underlying XML schema, and programmatically translates worksheet properties, data sources, visual parameters, and complex expressions into native Power BI (.pbix) architecture.
By deploying Pulse Convert, enterprise organizations automatically convert Tableau to Power BI while achieving an unmatched 75% to 90% automated conversion accuracy rate.
The Industry-First 30% Accuracy Challenge Guarantee
To prove the absolute technical superiority of our migration automation engine, Office Solution AI Labs offers an unmatched, public industry accuracy guarantee:
The Pulse Convert Challenge: If any competing Tableau to Power BI automated migration tool achieves even 30% accuracy on your enterprise dashboards in a live demonstration, Office Solution AI Labs will complete your entire enterprise migration completely free of charge.
This guarantee reflects the engineering precision embedded into Pulse Convert, ensuring that complex calculated fields, parameter sets, and visual layouts are preserved with maximum fidelity during migration.
Phase-by-Phase Technical Execution Guide
Executing an enterprise-grade migration requires a disciplined, multi-phase operational framework. Below is the step-by-step roadmap implemented by certified data engineers when migrating from Tableau to Power BI.
Phase 1: Comprehensive Discovery and Inventory Assessment
Catalog your entire reporting suite across Tableau Server or Tableau Cloud. Categorize workbooks based on usage analytics, business unit priority, data connectivity types, and technical complexity:
- Low Complexity: Simple static queries, basic bar/line charts, standard filters.
- Medium Complexity: Multi-table joins, standard LOD calculations, parameter controls.
- High Complexity: Advanced nested LOD expressions, custom VizQL spatial queries, complex table calculations, dynamic parameter actions.
Phase 2: Environment and Security Configuration
Establish target enterprise environments in Microsoft Power BI and Azure. Configure:
- Microsoft Fabric or Power BI Premium Workspaces.
- On-Premises Data Gateways or Virtual Network (VNet) Data Gateways for secure database access.
- Microsoft Entra ID (formerly Azure Active Directory) security group structures to replicate Tableau site roles.
Phase 3: Automated Conversion via Tableau to Power BI Accelerator
Run legacy Tableau workbook files through Pulse Convert by Office Solution AI Labs. The acceleration engine performs structural parsing:
- Data Source Extraction: Recreates connections to SQL databases, Snowflake, Databricks, or cloud stores into Power Query / M scripts.
- DAX Code Generation: Converts calculated fields, nested IF/THEN constructs, and LOD expressions directly into clean, optimized DAX measures.
- Visual Mapping: Translates Tableau visual elements (charts, tables, color palettes, marks cards, actions) into equivalent native Power BI visuals.
Phase 4: Data Validation and Parity Testing
After generating the native Power BI (.pbix) files, execute rigorous automated data validation:
- Row-Count Reconciliation: Verify that underlying data queries produce identical record counts across both platforms.
- Measure Value Auditing: Compare metric outputs side-by-side to ensure DAX measures match Tableau calculations down to the exact decimal point.
- Performance Profiling: Use DAX Studio and Power BI Performance Analyzer to optimize query execution speeds and VertiPaq memory usage.
Overcoming Complex Technical Migration Challenges
Migrating reporting engines presents unique technical edge cases. Below is how data engineers resolve the top hurdles when moving from Tableau to Power BI:
1. Replicating Advanced Tableau Level of Detail (LOD) Calculations
Tableau’s FIXED LOD calculates values using specified dimensions without reference to the view context.
To convert this logic into Power BI DAX, use the CALCULATE function combined with ALL or ALLEXCEPT.
{ FIXED [Region] : SUM([Sales]) }Region_Sales = CALCULATE(SUM(Sales[SalesAmount]), ALLEXCEPT(Sales, Sales[Region]))Pulse Convert automates this translation process, parsing nested LOD conditions directly into appropriate context-modifying DAX functions.
2. Handling Complex Table Calculations
Tableau table calculations (such as INDEX(), RANK(), RUNNING_SUM(), and WINDOW_AVG()) operate on the local data buffer returned to the worksheet.
In Power BI, these calculations are handled via DAX window functions including INDEX(), RANK(), OFFSET(), and WINDOW(). Utilizing a dedicated Tableau to Power BI Accelerator ensures these calculation windows are correctly indexed across target visual contexts without requiring complex manual DAX scripting.
Strategic and Financial ROI of Migrating to Power BI
Beyond technical execution, migrating from Tableau software vs Power BI provides substantial strategic, operational, and financial advantages across the corporate enterprise:
| Strategic Metric | Legacy Tableau Ecosystem | Modernized Power BI |
|---|---|---|
| Licensing Footprint | Separate Standalone Tier | Consolidated M365/Fabric |
| Security Architecture | Isolated Tableau Governance | Unified Microsoft Entra ID |
| Automation Savings | 100% Manual Effort Costs | 75%-90% Effort Reduction |
| Enterprise Adoption Rate | Limited to BI Analysts | Scaled Organization-Wide |
- Licensing and Infrastructure Optimization: By consolidating reporting into existing Microsoft 365, E5, or Microsoft Fabric capacity allocations, enterprises reduce software licensing overhead by up to 60%.
- Unified Security Governance: Power BI integrates directly with Microsoft Entra ID, Purview, and Microsoft 365 security policies, enforcing unified data loss prevention (DLP) and sensitivity labeling across enterprise assets.
- Accelerated Time to Market: By replacing standard manual 12-month migration projects with Pulse Convert by Office Solution AI Labs, enterprises complete full cloud migration cycles in a matter of weeks.
Conclusion & Next Steps for Cloud Architects
A successful enterprise transition from Tableau to Power BI hinges on selecting the right migration methodology. Moving away from manual visual rebuilds and adopting a semantic-layer-first strategy powered by automation allows organizations to preserve business continuity, maintain calculation accuracy, and minimize project timelines.
By leveraging Pulse Convert, organizations achieve 75% to 90% automated accuracy, backed by our risk-free guarantee.
Resources & Official Links
- Access legacy documentation via Tableau Official Site: https://www.tableau.com/
- Explore target platform capabilities on Microsoft Power BI: https://www.microsoft.com/en-us/power-platform/products/power-bi
- Learn about cloud semantic layer strategies in Microsoft Tech Community Architecture Guide: Microsoft Tech Community Architecture Guide
- Explore automated conversion technology on Pulse Convert Official Page: https://innovationalofficesolution.com/Tableau-To-PowerBI/
- Start a risk-free evaluation via Microsoft Marketplace Free POC: https://innovationalofficesolution.com/AnyBI-To-PowerBI-and-AnyETL-To-Fabric/
- Schedule a strategy consultation via Office Solution AI Labs Contact Page: https://innovationalofficesolution.com/contact/
Featured In Press Releases