Master Class: How to Convert Tableau to Power BI with AI Automation
 0|
0| 0
0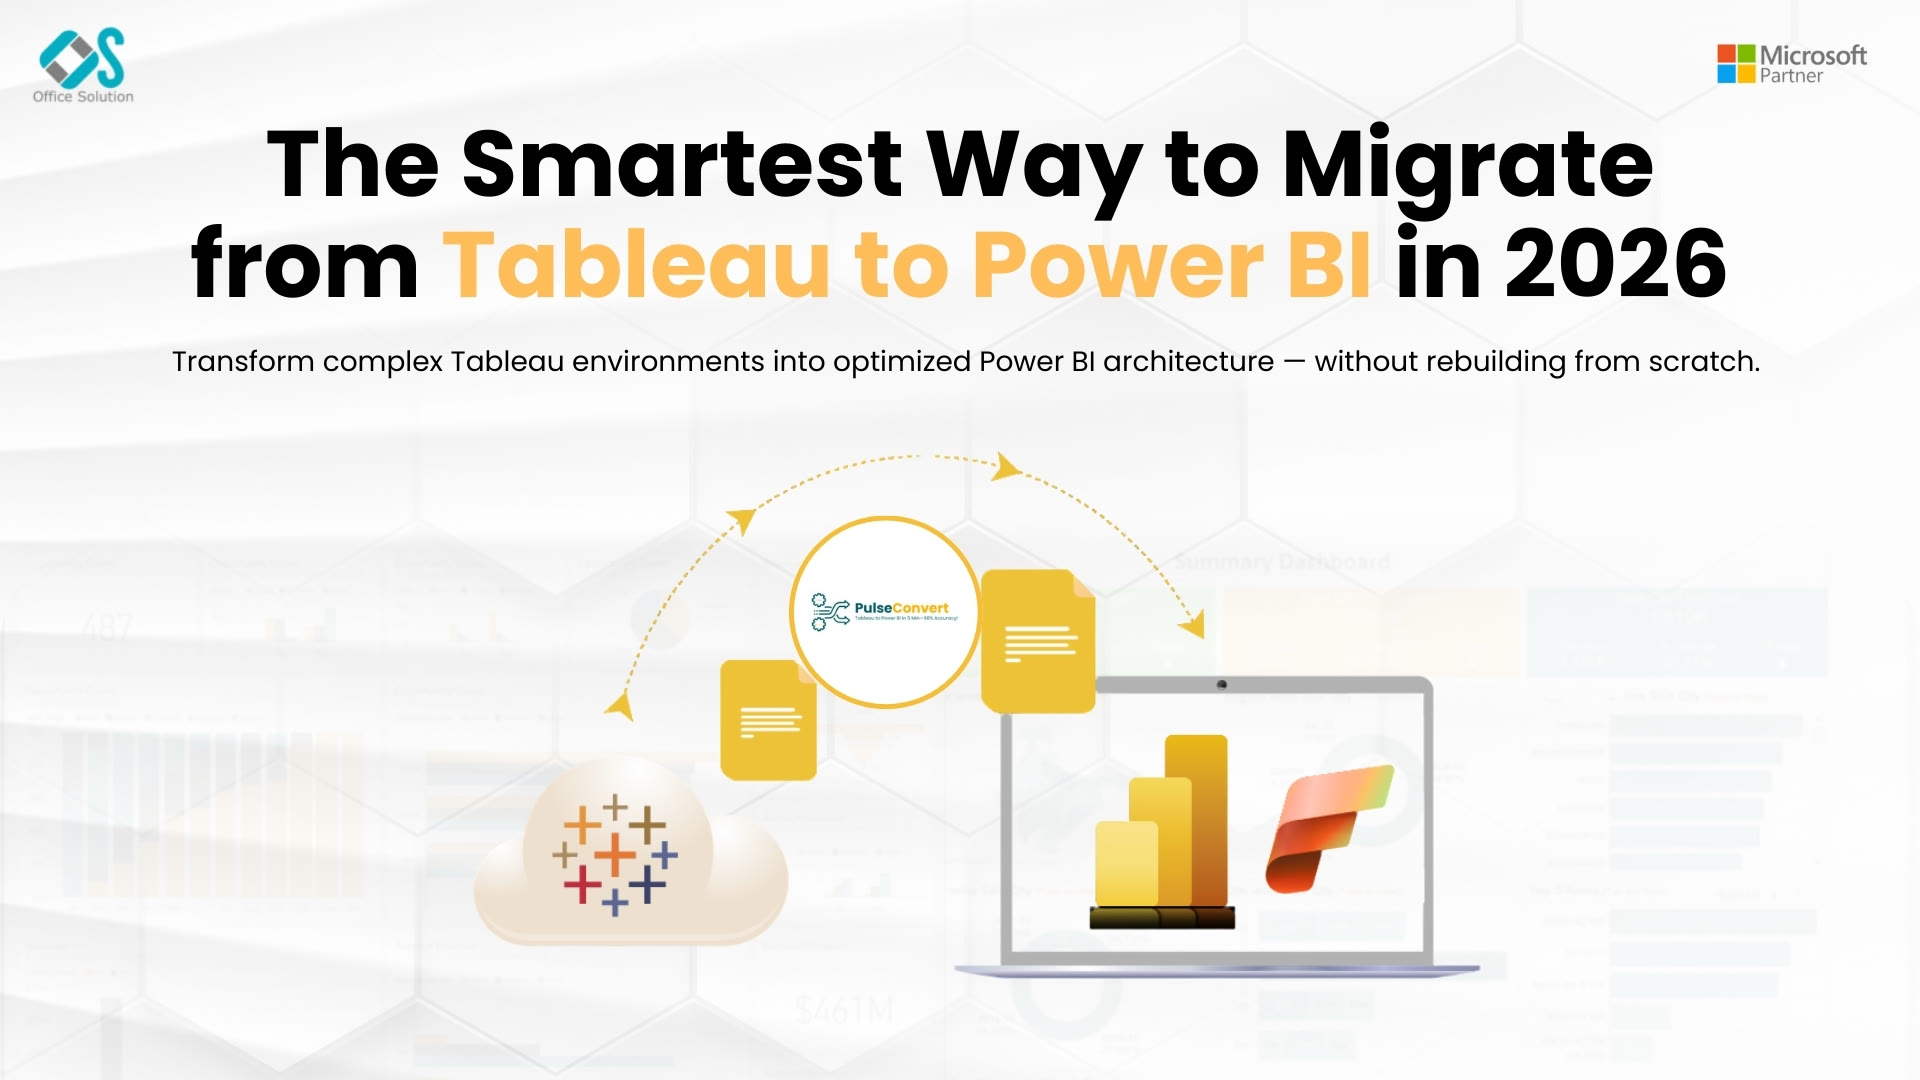
Table of Contents
Executive Summary: The Next Era of BI Conversion
As enterprise analytics portfolios expand, data engineering teams face increasing pressure to streamline reporting environments and eliminate redundant software tools. Transitioning your organization’s reporting assets from legacy visual discovery software to modern Microsoft cloud analytics has become a top priority for corporate technology leaders. This comprehensive technical guide provides an actionable roadmap on how to convert Tableau to Power BI using cutting-edge AI automation, robust semantic modeling, and structured quality assurance workflows.
Historically, platform conversion projects required manual, line-by-line code translation and hand-crafted dashboard reconstruction. Data engineers spent months recreating visual layouts, debugging calculated fields, and re-establishing database connections. Today, combining an AI-powered Tableau to Power BI migration framework with purpose-built conversion software radically accelerates execution speed while drastically reducing project risk.
Why Modern Enterprises Standardize on Power BI
Corporate IT departments are actively moving away from isolated analytics software in favor of integrated cloud platforms. When enterprise leaders evaluate why they should convert Tableau to Power BI, several operational advantages become clear:
- Unified Microsoft Ecosystem Integration: Power BI integrates natively with Microsoft 365, Teams, Excel, SharePoint, Azure Synapse, and Microsoft Fabric, allowing insights to flow directly into everyday business tools.
- Unmatched Enterprise Scalability: Powered by the VertiPaq engine and OneLake storage, Power BI handles billions of rows of data with lightning-fast response times, supporting both DirectQuery real-time analytics and high-speed in-memory storage.
- Comprehensive Security and Governance: Security teams can enforce uniform Row-Level Security (RLS) and Object-Level Security (OLS) policies integrated with Microsoft Entra ID and Purview, replacing fragmented workbook-level permissions.
- Lower Total Cost of Ownership: Standardizing on Microsoft licensing significantly reduces per-user costs while consolidating vendor management under a single enterprise agreement.
Introducing Pulse Convert: The Premier Migration Engine
Choosing the best Tableau to Power BI migration tool is the single most critical factor in determining your project's speed, accuracy, and overall execution cost. Relying entirely on manual development for large-scale migrations leads to extended project timelines, budget overruns, and formula inconsistencies across departments.
To eliminate these conversion roadblocks, Office Solution AI Labs developed Pulse Convert, an industry-leading automation platform specifically designed to streamline and accelerate your report conversion lifecycle. Introducing Pulse Convert into your development pipeline transforms complex manual reconstruction into an automated, highly reliable workflow. Pulse Convert directly reads legacy workbook files (.twb and .twbx), extracts data connections, translates formula logic, maps visual elements, and generates native Power BI project files (.pbix).
By combining advanced formula parsing algorithms with intelligent layout mapping, Pulse Convert achieves an automated accuracy rate of 75% to 90% across standard workbooks, calculated fields, dynamic parameters, and visual canvas layouts. This high precision reduces manual conversion effort by up to 60%, slashes development costs, and ensures complex business calculations are accurately translated into optimized DAX measures. To explore how this solution can accelerate your modernization project, visit Office Solution AI Labs.
Core Technical Steps to Convert Tableau to Power BI
Executing a seamless transition requires a structured, repeatable methodology. Following these five technical steps ensures data integrity, optimal performance, and high adoption across all user groups:
Step 1: Automated Inventory Assessment and Dependency Mapping
Before converting individual files, perform a complete assessment of your reporting repository. Connect to server metadata APIs to catalogue active workbooks, data sources, user views, and embedded calculated fields. Identify obsolete reports for retirement and group remaining dashboards into logical conversion waves based on business priority and technical complexity.
Step 2: Semantic Model Design and Data Source Configuration
Avoid recreating fragmented workbook-level models. Instead, follow the "Semantic Layer First" architecture recommended by the Microsoft Tech Community. Consolidate raw data connections into centralized star schemas. Rebuild custom embedded SQL queries using Power Query (M) transformations or backend database views to ensure optimal data loading and refresh performance.
Step 3: Automated Conversion via Pulse Convert
Process prioritized workbooks through Pulse Convert. The automation engine parses legacy XML, converts data connection bindings, translates calculated fields into DAX, and constructs foundational Power BI dashboard layouts.
Step 4: Technical DAX Refinement and Data Validation
After automated conversion, data engineers perform targeted reviews:
- Review translated DAX measures to ensure proper evaluation within Power BI filter contexts.
- Validate metric outputs by comparing query results between legacy reports and new Power BI datasets across identical filter combinations.
- Optimize report page rendering speed using Power BI Performance Analyzer.
Step 5: Governance Configuration, Deployment, and User Training
Publish verified semantic models and reports to secure Power BI Workspaces. Configure Row-Level Security (RLS) roles, establish scheduled gateway refreshes, and distribute reports via published Power BI Apps. Conduct tailored user onboarding sessions to train business analysts on DAX measures, dynamic slicers, and interactive mobile views.
Managing Complex Calculations: LODs vs. DAX
Translating complex calculation logic represents one of the most technical aspects of converting reporting platforms. In legacy workbooks, Level of Detail (LOD) expressions allow developers to calculate values at specific granularities independently of worksheet filters.
Understanding how these expressions translate into Power BI DAX patterns is essential for maintaining mathematical precision:
| Legacy Tableau Calculation | Equivalent Power BI DAX Pattern | Practical Application |
|---|---|---|
| FIXED LOD: {FIXED [Region] : SUM([Sales])} | CALCULATE(SUM(Sales), ALL(Table), Table[Region]) | Calculates regional sales totals regardless of visual filters. |
| INCLUDE LOD: {INCLUDE [Customer] : AVG([Sales])} | SUMX(VALUES(Table[Customer]), CALCULATE(AVG(Sales))) | Aggregates metrics at a finer detail than shown in the visual. |
| EXCLUDE LOD: {EXCLUDE [Category] : SUM([Sales])} | CALCULATE(SUM(Sales), REMOVEFILTERS(Table[Category])) | Ignores specific dimension filters on the visual canvas. |
Pulse Convert automates the majority of these complex formula translations, eliminating manual coding errors and ensuring mathematical consistency across platforms.
Best Practices for Enterprise Automation Success
To ensure your conversion project proceeds smoothly and delivers maximum value, incorporate these proven engineering best practices:
- Eliminate Technical Debt Early: Do not convert obsolete workarounds or unmonitored custom calculations. Use the assessment phase to clean up unused parameters, hidden worksheets, and obsolete data connections.
- Prioritize User Experience over Exact Pixel Cloning: Focus on delivering superior business insights, faster query performance, and dynamic cross-filtering rather than copying outdated visual formatting.
- Enforce Standardized DAX Naming Conventions: Establish clear DAX measures folders and standardized calculation names across all developer teams to ensure consistency across corporate reports.
- Execute Wave-Based Rollouts: Divide large reporting suites into manageable waves (e.g., by department or subject area). Validate each wave through parallel testing before decommissioning legacy reports.
Summary and Next Steps
Transitioning your enterprise analytics from legacy software to Microsoft Power BI unlocks substantial cost savings, enhances data governance, and prepares your organization for the future of AI-driven decision-making. By combining a structured methodology, centralized semantic modeling, and automated tools like Pulse Convert, technology teams can execute high-speed, zero-downtime conversions with complete confidence.
To evaluate your environment's conversion requirements, test automated conversion performance on your own workbooks, or initiate a risk-free pilot project, access a Free Trial / Free POC directly on the Azure Marketplace. To schedule a technical consultation with senior enterprise solution architects, feel free to Contact us today.
Get Pulse Convert on Azure Marketplace
Accelerate your Tableau to Power BI migration with AI automation. Access a Free Trial / Free POC directly on Azure Marketplace.
Speak with Our BI Migration Experts
To schedule a technical consultation with senior enterprise solution architects, feel free to contact us today.
Featured In Press Releases