How to Migrate from Tableau to Power BI with Pulse Convert: A Complete Enterprise Guide
 0|
0| 0
0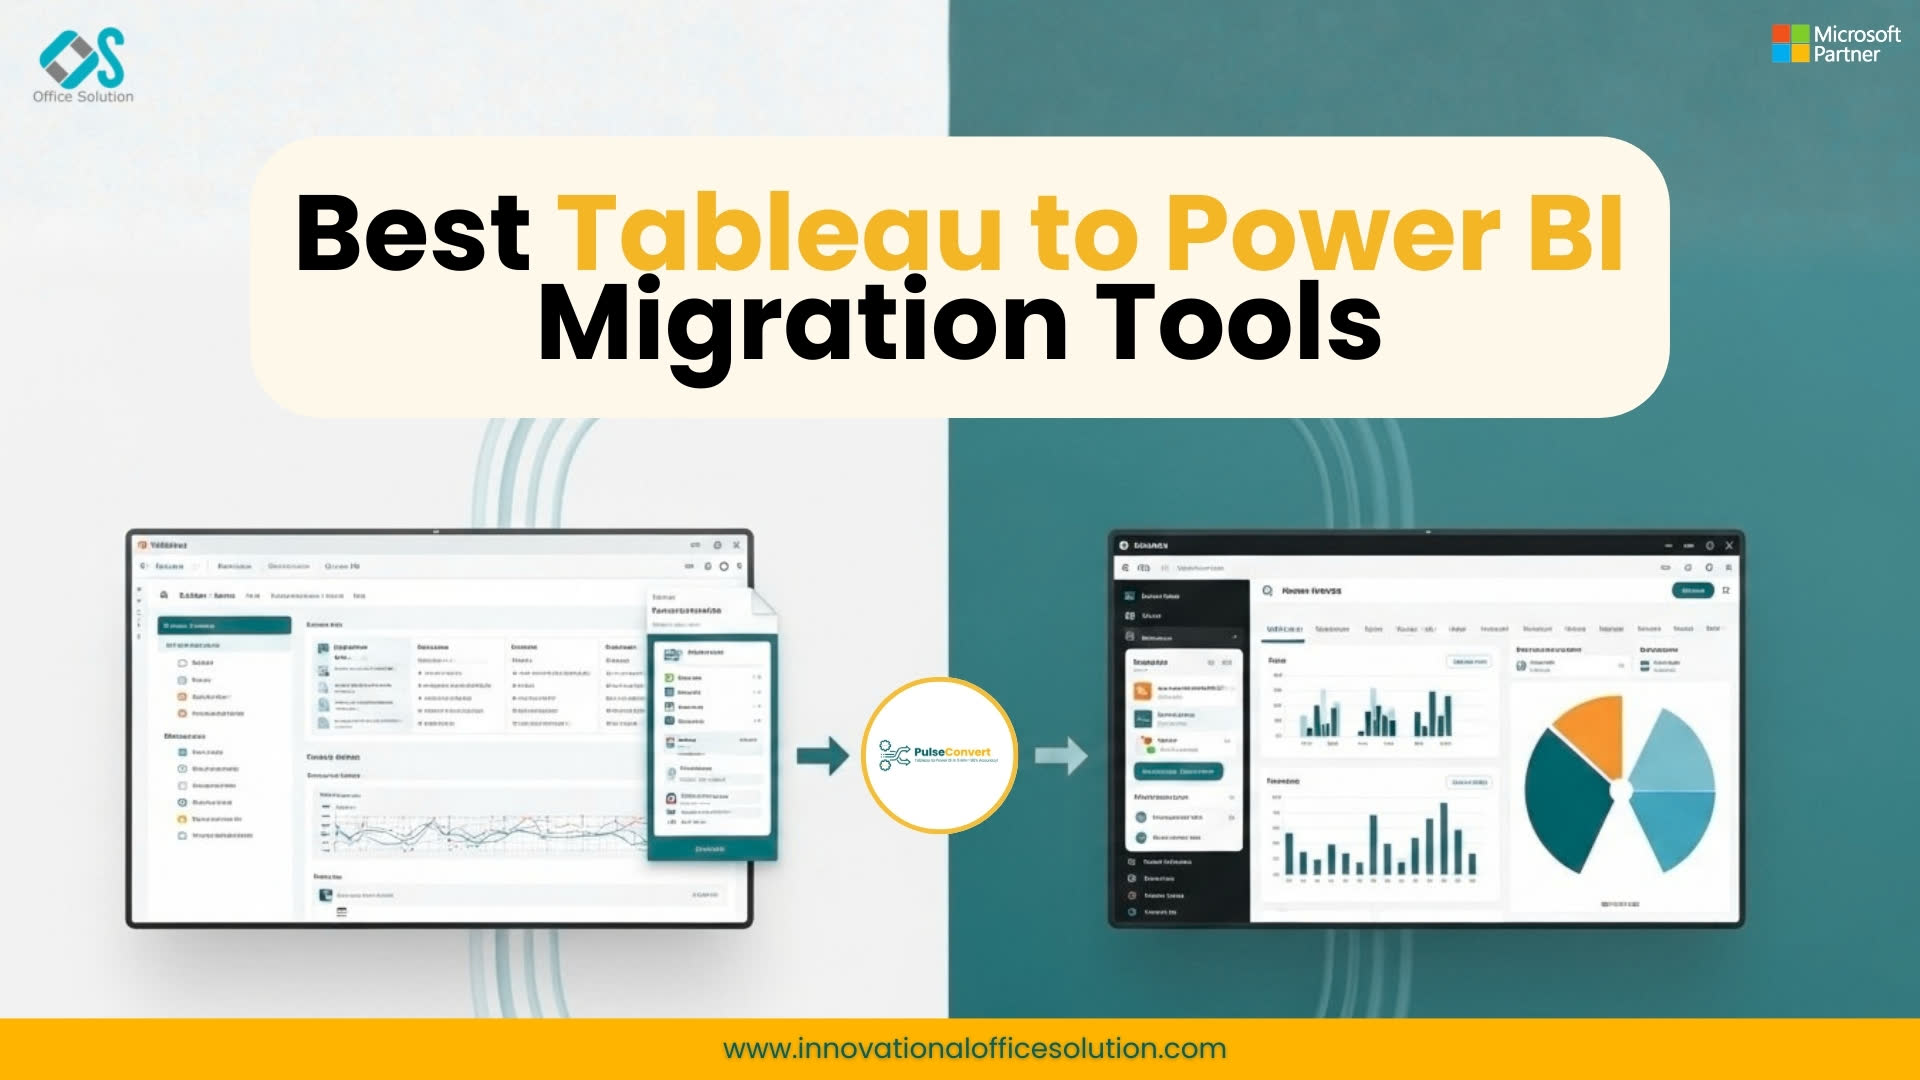
Table of Contents
Executive Overview: Modernizing Enterprise Analytics Architecture
The enterprise business intelligence landscape is undergoing a fundamental structural transition. For well over a decade, standalone visual exploration platforms dominated corporate reporting repositories. However, as cloud data architectures standardize on unified lakehouses, real-time telemetry, and embedded artificial intelligence, technology executives are re-evaluating their legacy reporting assets. As a result, engineering leadership across global enterprises is making the strategic decision to Migrate from Tableau to Power BI. This move aligns reporting infrastructure directly with Microsoft Fabric, enforces enterprise-wide data governance, and dramatically lowers total operating expenses.
Executing a successful platform transition involves much more than manually rebuilding dashboards chart by chart. Without a structured Tableau to Power BI migration guide, enterprise teams face severe operational risks. These include duplicated data engineering efforts, conflicting business logic definitions across departments, and prolonged adoption curves. To achieve a smooth, zero-downtime, zero-data-loss transition, data architects must follow a defined Tableau to Power BI migration process. This framework covers workbook rationalization, semantic model design, automated formula translation, and rigorous data parity validation.
This comprehensive operational guide is authored by Office Solution AI Labs to serve Chief Information Officers, Chief Data Officers, and Analytics Leads. It details the strategic drivers behind a Power BI migration from Tableau, outlines actionable Tableau to Power BI migration steps, and provides an authoritative Power BI migration automation guide to accelerate execution.
Strategic Drivers: Why Global Enterprises Are Migrating to Power BI
Evaluating a platform migration requires establishing a clear business case for executive stakeholders. Legacy visual discovery software often introduces governance silos, fragmented security, and inflating subscription costs. Transitioning reporting infrastructure to Power BI solves these operational hurdles through three main advantages:
- 1. Total Cost of Ownership (TCO) Consolidation: Standalone visualization tools require standalone user licensing tiers. Migrating to Power BI leverages existing Microsoft 365 E5 enterprise licensing or Azure Enterprise Agreements. This lowers software expenses while providing analytics access across the organization.
- 2. Centralized Semantic Governance: Legacy desktop workbooks frequently contain embedded data joins, custom calculations, and unmanaged parameters. This creates conflicting KPI definitions across business units. Power BI consolidates data logic into central, governed semantic models protected by Microsoft Entra ID and Purview.
- 3. Native Integration with Cloud Lakehouses: As enterprises move to cloud data architectures like Microsoft Fabric, Snowflake, or Databricks, static data extracts create operational delays. Power BI Direct Lake and DirectQuery modes allow real-time reporting directly on cloud lakehouses without creating unnecessary data copies.
Introducing Pulse Convert: Automated Tableau to Power BI Conversion
Rebuilding enterprise reporting environments manually is a major operational bottleneck. Manually re-creating visual layouts, re-establishing data connections, and rewriting complex calculated fields into Data Analysis Expressions (DAX) consumes thousands of engineering hours and introduces human error into critical business formulas.
To solve this challenge, Office Solution AI Labs created Pulse Convert, an automated migration engine built specifically to accelerate platform transitions. Pulse Convert parses legacy Tableau workbook XML structures (.twb and .twbx files), extracts embedded calculation logic, maps data schemas, and automatically generates native Power BI report templates (.pbix files) and reusable semantic models.
Using semantic parsing algorithms, Pulse Convert delivers an automated conversion accuracy rate of 75% to 90% across standard reports, calculated fields, dynamic parameters, and visual canvas layouts. This high level of automation reduces overall project delivery timelines by up to 60%, lowers conversion costs, and enables data teams to focus on semantic model optimization, security, and governance rather than manual report reconstruction.
The 5-Phase Tableau to Power BI Migration Process
Executing a predictable platform migration requires a structured engineering approach. The recommended migration process includes five defined phases:
Phase 1: Portfolio Discovery, Usage Audit, and Rationalization
Begin by auditing your existing report catalog. Use server metadata to identify active workbooks, view counts, and business owners. Categorize assets into four actionable buckets:
- Retire: Delete unviewed or duplicate dashboards (typically 30% to 40% of legacy report inventory).
- Consolidate: Combine redundant departmental reports into single interactive Power BI dashboards.
- Re-architect: Replace custom SQL extracts and complex data blends with optimized cloud star schemas.
- Convert: Flag core business-critical reports for automated platform migration.
Phase 2: Shared Semantic Layer and Data Gateway Architecture
Build a centralized semantic layer before converting individual visuals. Consolidate data sources into shared star-schema datasets, set up Power BI Enterprise Data Gateways for secure hybrid cloud connections, and establish automated refresh schedules.
Phase 3: Automated Conversion Execution
Pass prioritized workbooks through Pulse Convert to automate visual layout translation, transform calculations into DAX, convert data scripts into Power Query M, and generate target Power BI report files.
Phase 4: QA, DAX Refinement, and Data Parity Validation
Perform post-conversion engineering reviews. Validate translated DAX formulas against legacy outputs across identical filter contexts, optimize report loading speed with Power BI Performance Analyzer, and confirm visual alignment.
Phase 5: Security Alignment, Deployment, and Governance
Publish validated semantic models and reports to secure Power BI Workspaces. Configure Row-Level Security (RLS) policies matching legacy access rules, establish refresh schedules, and distribute finalized reports through targeted Power BI Apps.
Technical Deep-Dive: Translating LOD Expressions to DAX
A critical technical step during a Power BI migration from Tableau is converting Level of Detail (LOD) calculations into DAX formulas. Legacy LOD expressions evaluate aggregations independently of worksheet visual dimensions. In Power BI, calculation context is controlled dynamically using DAX filter context and row context.
| Calculation Type | Legacy Formula Logic | Equivalent Power BI DAX Pattern | Practical Application |
|---|---|---|---|
| FIXED LOD | {FIXED [Region] : SUM([Sales])} | CALCULATE(SUM(Sales), ALL(Table), Table[Region]) | Calculates regional sales totals regardless of visual filters on the page. |
| INCLUDE LOD | {INCLUDE [Customer] : AVG([Sales])} | SUMX(VALUES(Table[Customer]), CALCULATE(AVG(Sales))) | Aggregates metrics at a finer detail level than displayed in the chart. |
| EXCLUDE LOD | {EXCLUDE [Category] : SUM([Sales])} | CALCULATE(SUM(Sales), REMOVEFILTERS(Table[Category])) | Calculates total values while explicitly ignoring specific dimension filters. |
Automated engines like Pulse Convert programmatically convert these formula patterns into optimized DAX, preserving exact business logic across systems.
Power BI Migration Automation Guide: Best Practices
To maintain high performance and long-term platform stability, engineering teams following a Tableau to Power BI migration guide should apply these technical standards:
- Rule 1: Shared Datasets Over Ad-Hoc Connections: Avoid creating separate dataset connections for every single report. Build domain-specific semantic models (such as Sales, Supply Chain, or Finance) that support multiple downstream reports, ensuring consistent metric definitions across teams.
- Rule 2: Push Logic Upstream: Perform data cleaning and transformation in cloud database views, dbt models, or Power Query M scripts instead of DAX calculated columns. Reserving DAX for dynamic measures improves query speeds and optimizes memory usage.
- Rule 3: Model-Level Row Security: Apply Row-Level Security (RLS) directly within shared semantic models rather than individual reports. This guarantees consistent data access controls across Power BI Service, Microsoft Teams, and embedded applications.
Change Management and User Enablement
Successful migration projects require equal focus on user adoption and technical execution. Moving from desktop-centric reporting to modern cloud dashboards requires structured user enablement:
- Establish a BI Center of Excellence (CoE): Create a centralized governance group to publish standard visual templates, define security guidelines, and support departmental report creators.
- Role-Based Training Programs: Deliver tailored onboarding for report consumers, data analysts, and BI developers. Consumers focus on interactive filtering and exporting, while developers focus on DAX, Power Query, and semantic model design.
- Managed Cutover Window: Run legacy and new reporting environments in parallel for a short, defined window (such as 30 days) during user acceptance testing. This builds user trust in data consistency before retiring legacy infrastructure.
Enterprise ROI and Long-Term Value
Transitioning to Power BI using an automated conversion model provides significant financial and operational returns:
- Lower Software Spend: Consolidating licenses into Microsoft 365 or Azure agreements significantly reduces operational software expenses.
- Faster Time-to-Value: Using Pulse Convert shortens project timelines from months to weeks, enabling faster delivery of modern analytics to business teams.
- AI-Ready Foundation: Centralizing data into Power BI semantic models creates a strong foundation for Microsoft Fabric and Azure OpenAI capabilities.
To assess your environment's migration readiness, calculate potential license savings, or launch a proof of concept, access a Free Trial / Free POC directly on the Azure Marketplace. To speak with our enterprise solution team about custom migration requirements, feel free to Contact us today.
Free Trial / Free POC
Organizations seeking to evaluate their potential ROI, request a technical environment assessment, or kickstart their migration journey with a hands-on proof of concept can access a Free Trial / Free POC directly on the Azure Marketplace.
Featured In Press Releases