The Hidden Cost of Visual BI: Why Enterprise Leaders Are Re-engineering the Tableau to Power BI Migration Approach
 0|
0| 0
0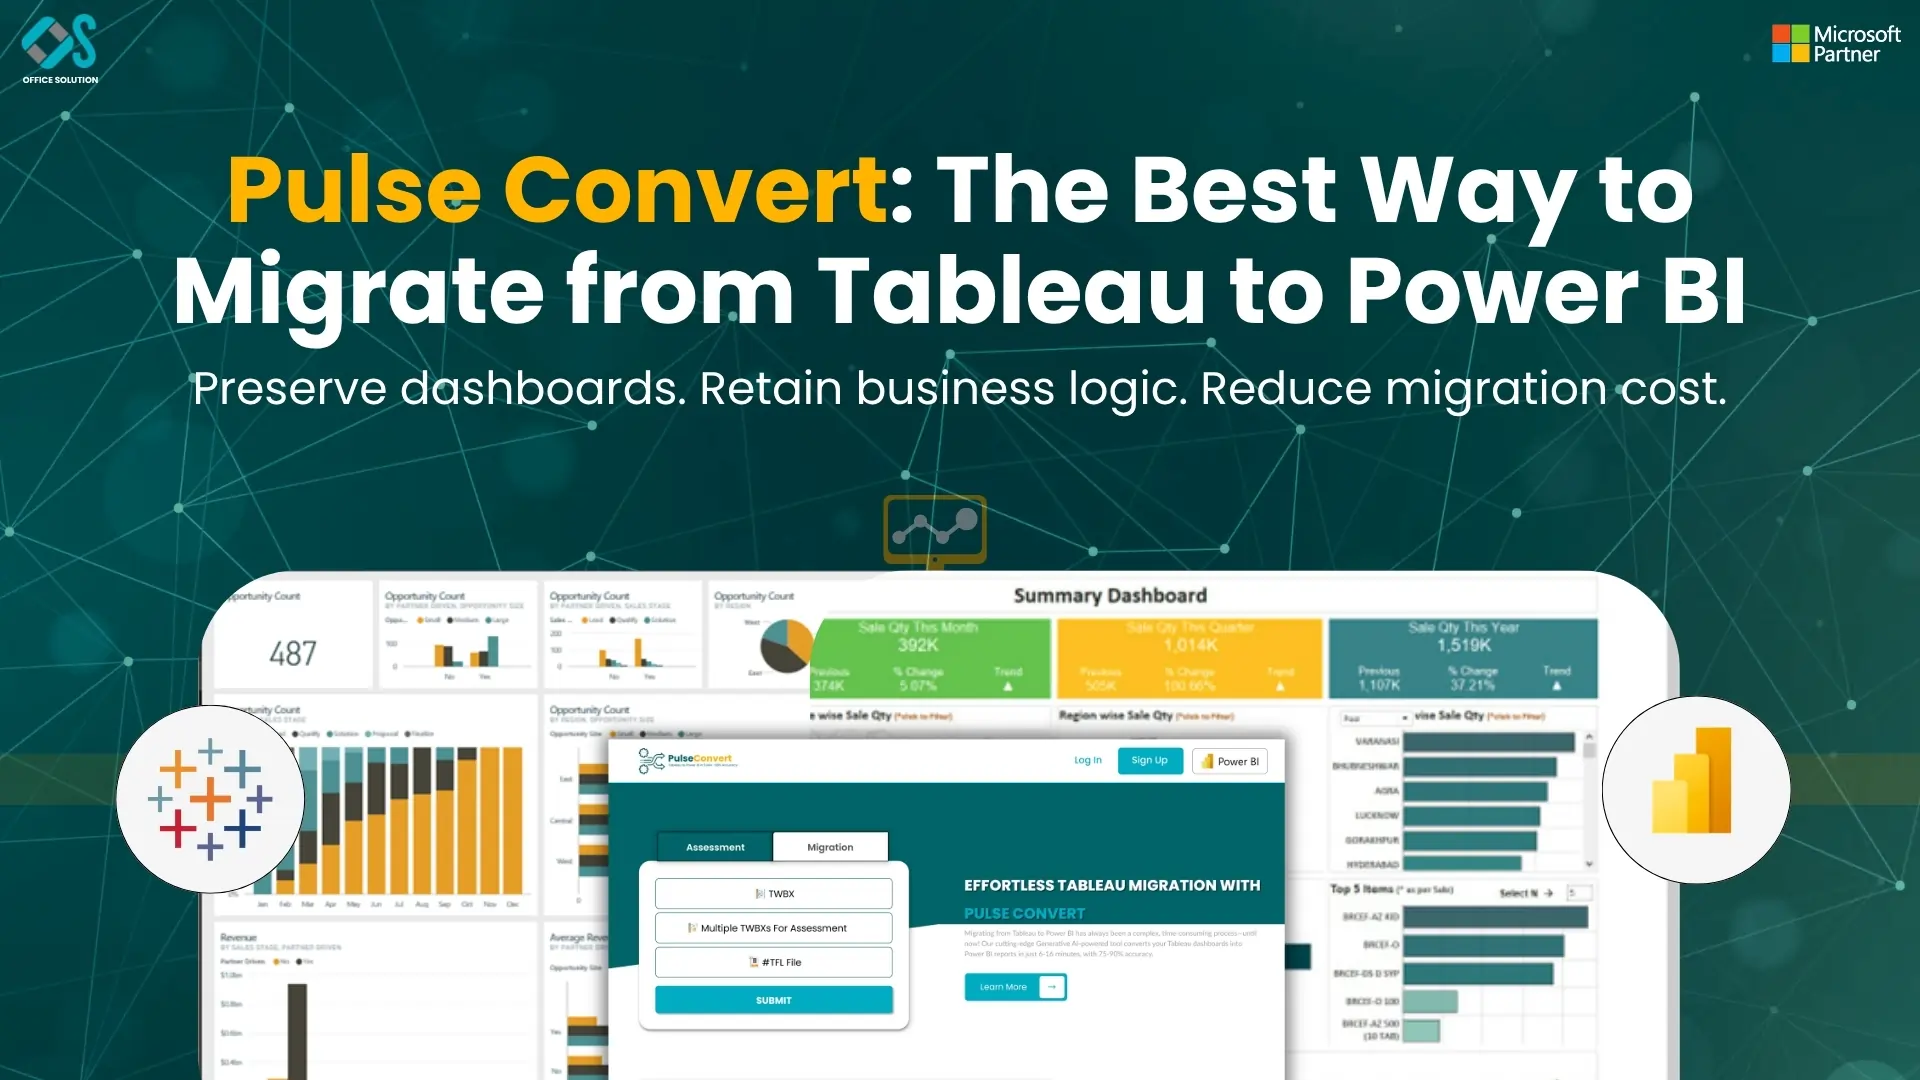
Table of Contents
Enterprise business intelligence frameworks are facing a major reckoning driven by licensing costs, cloud consolidation pressures, and the need for unified data governance. For over a decade, many corporations relied heavily on Tableau to handle complex data visualizations and build interactive dashboards. While its visual engine offered strong dashboard creation capabilities, the modern enterprise demands deeper ecosystem integration, cost-effective scaling, and centralized data management. This shifting focus explains why technology leaders are actively executing a programmatic migration from Tableau to Power BI.
Moving an entire corporate reporting infrastructure between two fundamentally different BI ecosystems is a massive challenge. A typical enterprise deployment includes thousands of workbooks, deeply nested calculations, custom Level of Detail calculations, and specific data access setups. Attempting a manual translation of these elements introduces high labor costs, lengthy operational delays, and significant risks of human error. To mitigate these risks, organizations require a highly structured, automated Tableau to Power BI migration approach that streamlines workbook conversion, protects historical data logic, and minimizes business disruption.
Technology leaders who want to maximize their returns are moving away from manual code rewrites and embracing intelligent automation frameworks instead. Manual migrations frequently stall due to the sheer volume of data calculations that need to be rebuilt in DAX. By utilizing specialized automation software like Pulse Convert, companies can achieve a guaranteed 75% to 90% automated migration of their existing dashboards and data logic. This software interprets workbook metadata, translates calculation formulas, and reconstructs reporting layouts inside Power BI, saving thousands of engineering hours.
Gap Between Tableau Power BI Engines
To build a reliable conversion framework, data architects must first address the foundational differences between the underlying calculation engines. The legacy visual platform operates primarily on a visualization-first model, where data queries and calculations are deeply tied to the visual objects on the dashboard canvas. In contrast, the Microsoft cloud framework runs on a data-first architecture, separating the central semantic data model from the visual reporting canvas. This structural difference requires careful planning during any enterprise migration from Tableau to Power BI.
A common technical challenge during this transition involves translating Level of Detail formulas into efficient DAX expressions. The legacy visualization platform relies on specific calculation formulas to compute values at different dimensions of data granularity, regardless of the visual layout. When you migrate from Tableau to Power BI, these calculations must be mapped to DAX functions like CALCULATE, ALLEXCEPT, or SUMMARIZE. Failing to optimize these formulas during translation can result in severe query latencies, sluggish dashboard performance, and inaccurate metric reporting for business users.
Security models also require a major rethink during a platform transition. The legacy system relies on specific site roles, user filters, and workbook-level permissions to control data access. The Microsoft framework simplifies this management by implementing Row-Level Security directly inside the central semantic data model. Defining security boundaries at the data layer ensures that access restrictions remain active across all downstream workspaces, regardless of how a business user queries the data.
Designing a Modern Ingestion Pipeline for Cloud BI Consolidation
A contemporary data platform's strategic commercial benefit goes well beyond just cutting costs. Businesses can eliminate separate data silos and create a single source of truth for their company assets by combining reporting infrastructure within the Microsoft SaaS environment. For businesses moving their backend data lakes to unified storage architectures, where reporting tools may connect straight to central data repositories without duplicating files, this optimization has a particularly significant impact.
Cloud engineers must create ingestion workflows that enable quick data processing and excellent analytical performance while setting up an efficient data pipeline. Complex data extracts used by legacy reporting models sometimes necessitate regular schedule refreshes, which strain source databases and cause data synchronization problems. By switching to a single cloud platform, teams can use direct lake storage designs and live connection choices, which let business users conduct operational queries in real time without experiencing performance lags.
To support this technical evolution, our deployment engineering team at Office Solution AI Labs provides field-tested implementation blueprints and advanced conversion software. We invite large organizations to review our comprehensive enterprise migration frameworks by reading our technical transition blueprint. Business leaders can also experience this technical modernization firsthand via a Free trial of our automation tools, allowing your team to see how automated code translation can accelerate your business transformation.
Executing Code Translation and Validating Data Accuracy
A corporate reporting modernization's execution phase is only concerned with data validation, automated conversion, and metadata analysis. Developers must manually reproduce the visual structure in the target desktop application, access each individual worksheet, and reverse-engineer the calculation algorithm in order to convert dashboards manually. For large organizations, this manual technique frequently results in a significant bottleneck that prolongs project timeframes by months or even years.
Technology teams can completely avoid this laborious manual conversion procedure by including the Pulse Convert engine into your migration strategy. The program takes the essential calculation logic from the underlying XML information of your current files and converts those definitions into DAX expressions that are entirely compatible. By effectively converting 75% to 90% of your data logic automatically, this automation takes care of the labor-intensive backend code production, freeing up your data engineers' time for final formatting and visual optimization.
Another essential prerequisite for switching enterprise business intelligence solutions is data validation. Data engineers must perform parallel testing procedures to ensure that the figures match precisely between the two systems before decommissioning any outdated reporting servers. To guarantee total accuracy prior to production deployment, automated validation scripts compare data outputs side by side using identical query parameters, highlighting any differences in calculation logic or data extraction.
Managing the Human Element: Training and System Cutover
The final phase of an enterprise data platform transformation centers on user training, operational deployment, and decommissioning legacy infrastructure. A common pitfall in large-scale tech migrations is failing to prepare business users for the interface changes of the new application. Even if the underlying calculations are completely accurate, users may resist the new system if they struggle to navigate the new workspace layouts or interactive filtering controls.
Organizations should implement a systematic change management program in conjunction with the technological migration to avoid this conflict. While teaching corporate executives how to use dashboards on mobile devices guarantees seamless adoption, role-specific training sessions assist business analysts in adjusting to the data model interface. In addition to creating a first line of support, designating power users inside each department enables teams to promptly address basic inquiries during the system cutover.
The business can safely start shutting down legacy reporting servers when user acceptance testing is finished and department heads approve the new dashboards. High software maintenance costs are eliminated, software compliance tracking is made easier, and data clutter is removed by decommissioning this outdated infrastructure. The company is now completely set up to take advantage of advanced data analytics, unified data governance across all business divisions, and real-time business insights.
Frequently Asked Questions (FAQs)
1. What is the main advantage of the Pulse Convert automation engine?
The main advantage is the drastic reduction in manual development time and human error. Pulse Convert reads your existing workbook metadata and provides a guaranteed 75% to 90% automated migration of your calculation logic and dashboard layouts. This automation ensures that complex business definitions are translated into clean DAX expressions quickly, allowing your engineering teams to focus entirely on visual optimization and user training.
2. How do we handle custom calculations during a platform migration?
Simple calculations scale and translate directly through automated conversion tools. Complex custom formulas, such as deeply nested expressions or specific dimension calculations, are analyzed by the automation software and converted into equivalent DAX functions. Any highly specific visual formatting that falls outside the automated transformation range is finalized manually by data developers during the polishing phase.
3. Will our data warehouse connections need to be rebuilt from scratch?
No. The underlying data warehouse infrastructure remains intact. However, the connection methods are updated to align with modern cloud practices. Instead of using isolated dashboard extracts, the new architecture connects directly to your central databases using live queries or unified semantic layers, ensuring better data consistency and eliminating replication delays.
4. How do we ensure that dashboard numbers match between both platforms?
Data teams run parallel validation processes where both reporting platforms are updated simultaneously during a testing window. Automated validation scripts compare the metric outputs of both dashboards using identical input parameters. Any discrepancies caused by differing calculation engines are identified and corrected, ensuring complete data accuracy before going live.
5. How does licensing change when transitioning to the Microsoft BI ecosystem?
The transition delivers major cost efficiencies by shifting from expensive user-specific visualization licenses to an integrated capacity model. If your company already uses Microsoft 365 or cloud data suites, you can leverage existing corporate capacities to distribute dashboards to thousands of business users without paying for individual viewing licenses, drastically reducing your total cost of ownership.


