The Enterprise Data Blueprint: Driving Corporate Growth with High-Performance BI Frameworks
 0|
0| 0
0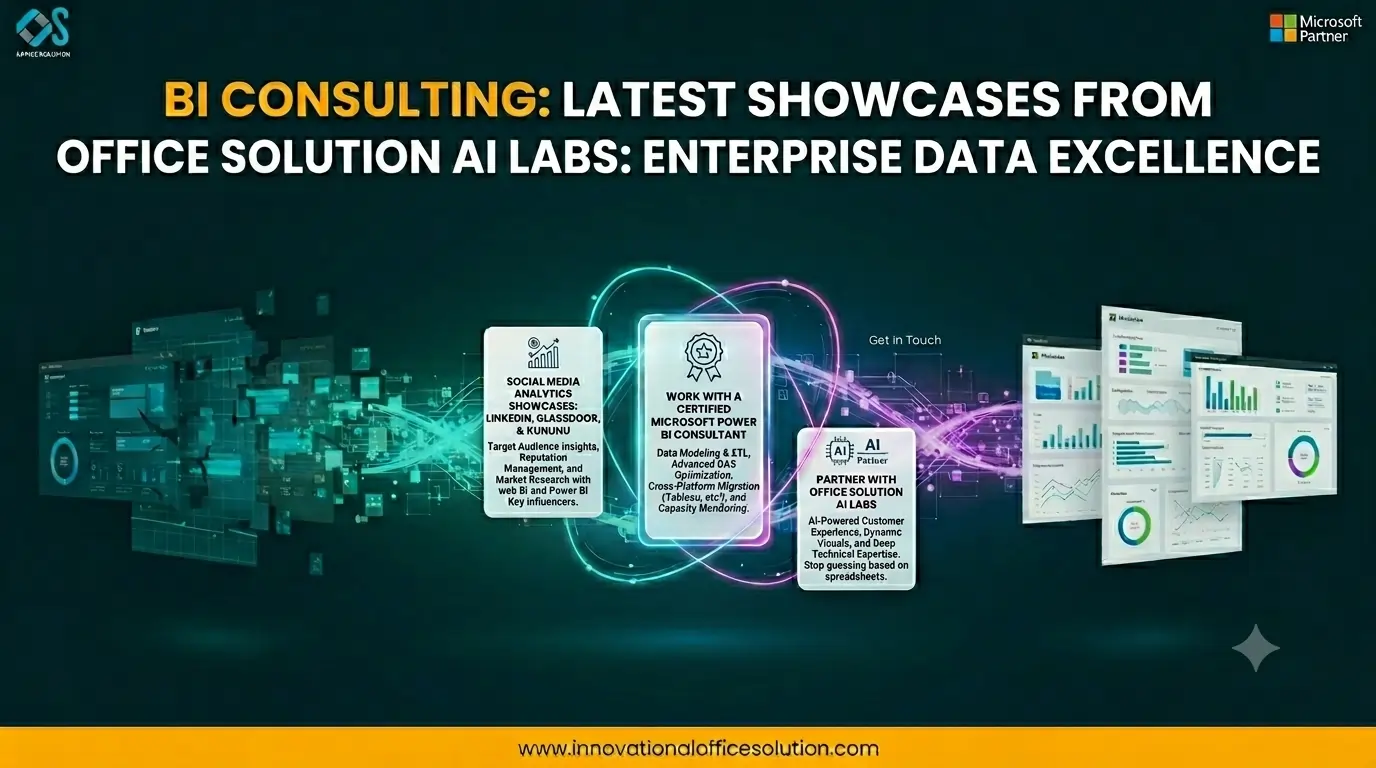
Table of Contents
Defining the Modern Corporate Intelligence Strategy
Many business units treat reporting setups as cosmetic design projects, asking internal generalists to compile charts directly on top of active transactional applications. While this surface-level strategy provides a fast visual deliverable, it creates deep processing bottlenecks as data expands over time. To understand how advanced engineering practices transform operational visibility, read our definitive guide on enterprise data framework strategy: Enterprise Data Framework Strategy. True engineering-first data management builds a clear, automated path that completely isolates live transactional operations from downstream analytical models. Enterprise data moves through structured extraction, comprehensive transformation, and clean centralized semantic consolidation. This strategic separation keeps live business platforms running fast while providing analysts with a reliable, historical environment for deep data investigation.
Establishing this structural groundwork across a multi-branch organization requires expert BI strategy consulting. This critical planning stage defines consistent, standardized naming frameworks for key metrics across all geographical regions, maps your active data origins, and builds a cloud processing layout designed to expand alongside your long-term corporate objectives.
Engineering High-Performance Infrastructure: Star Schema Configurations
At the absolute center of high-speed business analytics is the deliberate conversion of unorganized database entries into optimized star schemas. Inexperienced setups regularly squeeze hundreds of unrelated columns into single, massive flat data tables. This disorganized format forces analytical systems to scan millions of rows of redundant text during simple filter queries, causing noticeable lag for front-end users.
Professional BI implementation consulting removes these underlying system delays by restructuring unorganized databases into highly indexed, relational components:
- Central Fact Tables: These house the quantitative, numerical metrics of your operations—such as real currency revenue, manufacturing run runtimes, or medical claims values—alongside specific destination keys.
- Contextual Dimension Tables: These flank your central metrics, housing unique reference attributes—such as customer demographics, physical store boundaries, or corporate fiscal calendars.
By separating your quantitative transactions from descriptive contextual elements, complex data calculations execute almost instantly. Furthermore, strict data cleansing rules are applied at the extraction gate. This engineering practice ensures that empty values are handled properly, regional timestamp formats match perfectly across international boundaries, and naming definitions remain consistent across all branches of the global organization.
Performance Optimization and Visual Engineering
Once your central database is cleanly structured, front-end visual delivery must be designed for maximum speed. Delivering high-impact business intelligence requires professional BI dashboard consulting to ensure reports scale seamlessly alongside your expanding corporate footprint. Without expert database optimization, massive datasets will cause complex report files to freeze during peak morning operational lookups.
Performance tuning at this scale involves optimizing backend data transformation paths. This means using advanced query techniques to push data heavy lifting back to your primary database servers, writing efficient formulas to minimize system memory use, and implementing automated cache refreshes during off-peak hours. The resulting BI reporting solutions deliver lightning-fast page responsiveness, clear navigation paths, and rock-solid role-based data security that keeps sensitive internal numbers protected.
Social Analytics Showcases: Converting Unstructured Web Data into Strategic Assets
Modern business analytics extends far beyond internal, structured enterprise data. True market positioning requires capturing external public sentiment and human resource feedback. However, public web BI data is highly unstructured, conversational, and complex to map cleanly against standard financial metrics.
To solve this tracking challenge, Office Solution AI Labs engineers turnkey analytical showcases that transform public web sentiment into reliable data assets. Explore our complete capabilities and full suite of service offerings at our central hub: Business Intelligence Consulting.
LinkedIn Platform Analytics
Understanding target audiences is critical for sustained market acquisition. Our LinkedIn Analytics platform operates as an integrated web BI asset that uncovers deep customer insights by leveraging Power BI Key Influencers. Instead of displaying empty vanity metrics like basic profile views, this solution identifies the exact content categories and professional titles driving your B2B lead generation. By establishing strong Power BI Relationships between content topics and organic inbound traffic, marketing teams can deploy budgets with complete clarity.
Glassdoor Sentiment Mapping
Employer branding directly affects corporate profitability via talent recruitment timelines and workforce retention costs. Our Glassdoor Analytics system processes qualitative employee feedback into clear, structured assets to guide your human resources trajectory. By deploying specialized web BI setups, executives monitor employer reputation metrics across disparate operational branches. The engine leverages Power BI Key Influencers to isolate the core operational factors—such as management updates, pay equality, or work-life balance—that correlate directly with workforce sentiment, letting leaders solve cultural friction points before they damage organizational output.
Kununu Market Analytics
For brands expanding across international competitive spaces, localized competitor workplace data offers a substantial strategic advantage. Our Kununu Analytics module delivers a structured framework for target audience analysis and competitive market research. By bringing unorganized web BI fields straight into your corporate analytical ecosystem, product and service divisions can spot regional market preferences early. Leveraging Power BI Key Influencers highlights emerging talent demands and operational gaps across your competitor landscape, ensuring your local business growth models stay highly responsive.
Industry Verticals: Deploying Tailored Analytical Blueprints
Data models must be engineered to reflect the unique day-to-day realities of the markets they serve. Generic templates fail because the regulatory rules of an international banking institution do not align with the fast inventory turnover of retail or the compliance demands of modern healthcare.
Healthcare
In clinical environments, data silos across separate Electronic Health Records (EHR) and scheduling platforms slow down decision-making. By applying modern web BI strategies, healthcare networks can safely blend these disconnected fields into an integrated cloud space. Utilizing clean Power BI Relationships allows hospital operations teams to evaluate patient health outcomes alongside resource speeds, which helps lower hospital re-admission rates and optimize emergency room staff placements.
Manufacturing
On a fast-paced factory floor, unplanned machinery downtime and raw material scrap create major financial drains. Production managers need real-time insight into the operational efficiency of every single line. By utilizing Power BI Key Influencers, plant engineers can look beyond basic historical reports to isolate the hidden root causes of production slowdowns. Evaluating variables like ambient floor humidity, raw material batches, and operator shift rotations reveals the exact conditions that cause component defects, letting teams adjust machinery setups proactively to save on raw materials.
Retail
Retail brands operate in high-volume, thin-margin environments where consumer tastes pivot quickly. Waiting for weekly or monthly sales reports to populate creates major inventory liabilities. With web BI insights, retail teams can design predictive pricing models and automated supply chain paths. Building solid Power BI Relationships helps inventory managers connect real-time physical point-of-sale data with upstream distribution levels, keeping high-demand items in stock while preventing costly overstock issues on slower-moving product lines.
BFSI (Banking, Financial Services, and Insurance)
Financial networks process massive data volumes under strict regulatory safety frameworks. For these entities, data access security and absolute numbers accuracy are paramount. Using specialized Power BI features allows financial firms to analyze market trends and track customer engagement safely. Incorporating Power BI Key Influencers gives risk officers the ability to screen incoming transactions for anomalies, improving fraud detection models and credit risk assessments while ensuring complete regulatory compliance.
FMCG (Fast-Moving Consumer Goods)
FMCG companies operate on thin margins where distribution speed determines market success. Success requires matching high-volume factory outputs with fast-moving retail consumer demand. Deploying modern BI tools allows brand managers to optimize regional inventory placements, predict shifting consumer preferences, and measure the performance of promotional campaigns. Web BI solutions give distribution teams a clear view of logistics networks, helping them streamline delivery paths and minimize product expiration rates.
Departmental Architecture: Establishing Unified Enterprise Alignment
To build a true single source of truth, an organization's central data framework must serve every internal department equally, ensuring all business units rely on identical metric formulas.
| Department | Primary Key Performance Metrics Monitored | Strategic Business Objective |
|---|---|---|
| Sales | Pipeline velocity, customer acquisition cost (CAC), regional sales cycle lengths | Finding growth opportunities, managing real-time revenue forecasts |
| Marketing | Multi-channel attribution paths, customer lifetime value (CLV), campaign ROI | Personalizing target campaigns, optimizing marketing spend across digital channels |
| Finance | Departmental budget variations, automated cash flow runway, working capital ratios | Maximizing investment strategies, automating accurate corporate forecasting |
| Operations | Supply chain lead times, equipment utilization rates, inventory turnover | Eliminating fulfillment bottlenecks, increasing production efficiency |
When these primary corporate branches pull from a single semantic model, leadership teams no longer waste time during executive syncs arguing over which numbers are correct. Instead, meetings focus directly on planning corporate expansions based on trusted metrics. To learn how to bridge your raw analytical data directly into executive long-term planning, see our technical roadmap: Transforming Raw Analytics into Corporate Strategy: Microsoft Power BI Consulting Services.
Work with a Certified Microsoft Power BI Consultant
Building dashboards is simple; architecting an enterprise data framework requires deep expertise. Every Microsoft Power BI consultant on our engineering team brings deep hands-on experience in database management, data engineering, and predictive analytics.
When you collaborate with our consulting team, you gain direct access to technical specialists who specialize in:
- Data Modeling and ETL Pipelines: Extracting, transforming, and loading structured and unstructured data using Power Query and SQL.
- Advanced DAX Optimization: Writing clean, efficient Data Analysis Expressions to minimize processing overhead and maximize query speeds.
- Cross-Platform Migration: Seamlessly shifting your corporate reports from legacy systems—such as Tableau, QlikView, IBM Cognos, or SAP Business Objects—directly into Microsoft Fabric and Power BI without data loss.
- Capacity Monitoring: Running comprehensive load testing tools and monitoring premium capacity usage to control enterprise cloud computing costs.
Partner with Office Solution AI Labs
Stop guessing based on incomplete spreadsheets. Partner with a dedicated Power BI consultancy that understands data engineering, advanced visuals, and smooth enterprise software integration. As an established implementation partner across major cloud and data platforms, Office Solution AI Labs has the deep technical expertise required to make your data work for you.
Get clear visibility into your operations, control your premium capacity overhead costs, and give your executive leadership team the real-time insights they need to execute corporate strategies successfully.
Ready to Modernize Your Enterprise Data Architecture?
Transform your company's data architecture from disconnected dashboards into a unified enterprise intelligence system. Schedule an initial infrastructure evaluation with our data engineering team today.


