The Executive Blueprint for Enterprise BI Transformation: A Phased Tableau to Power BI Migration Process
 0|
0| 0
0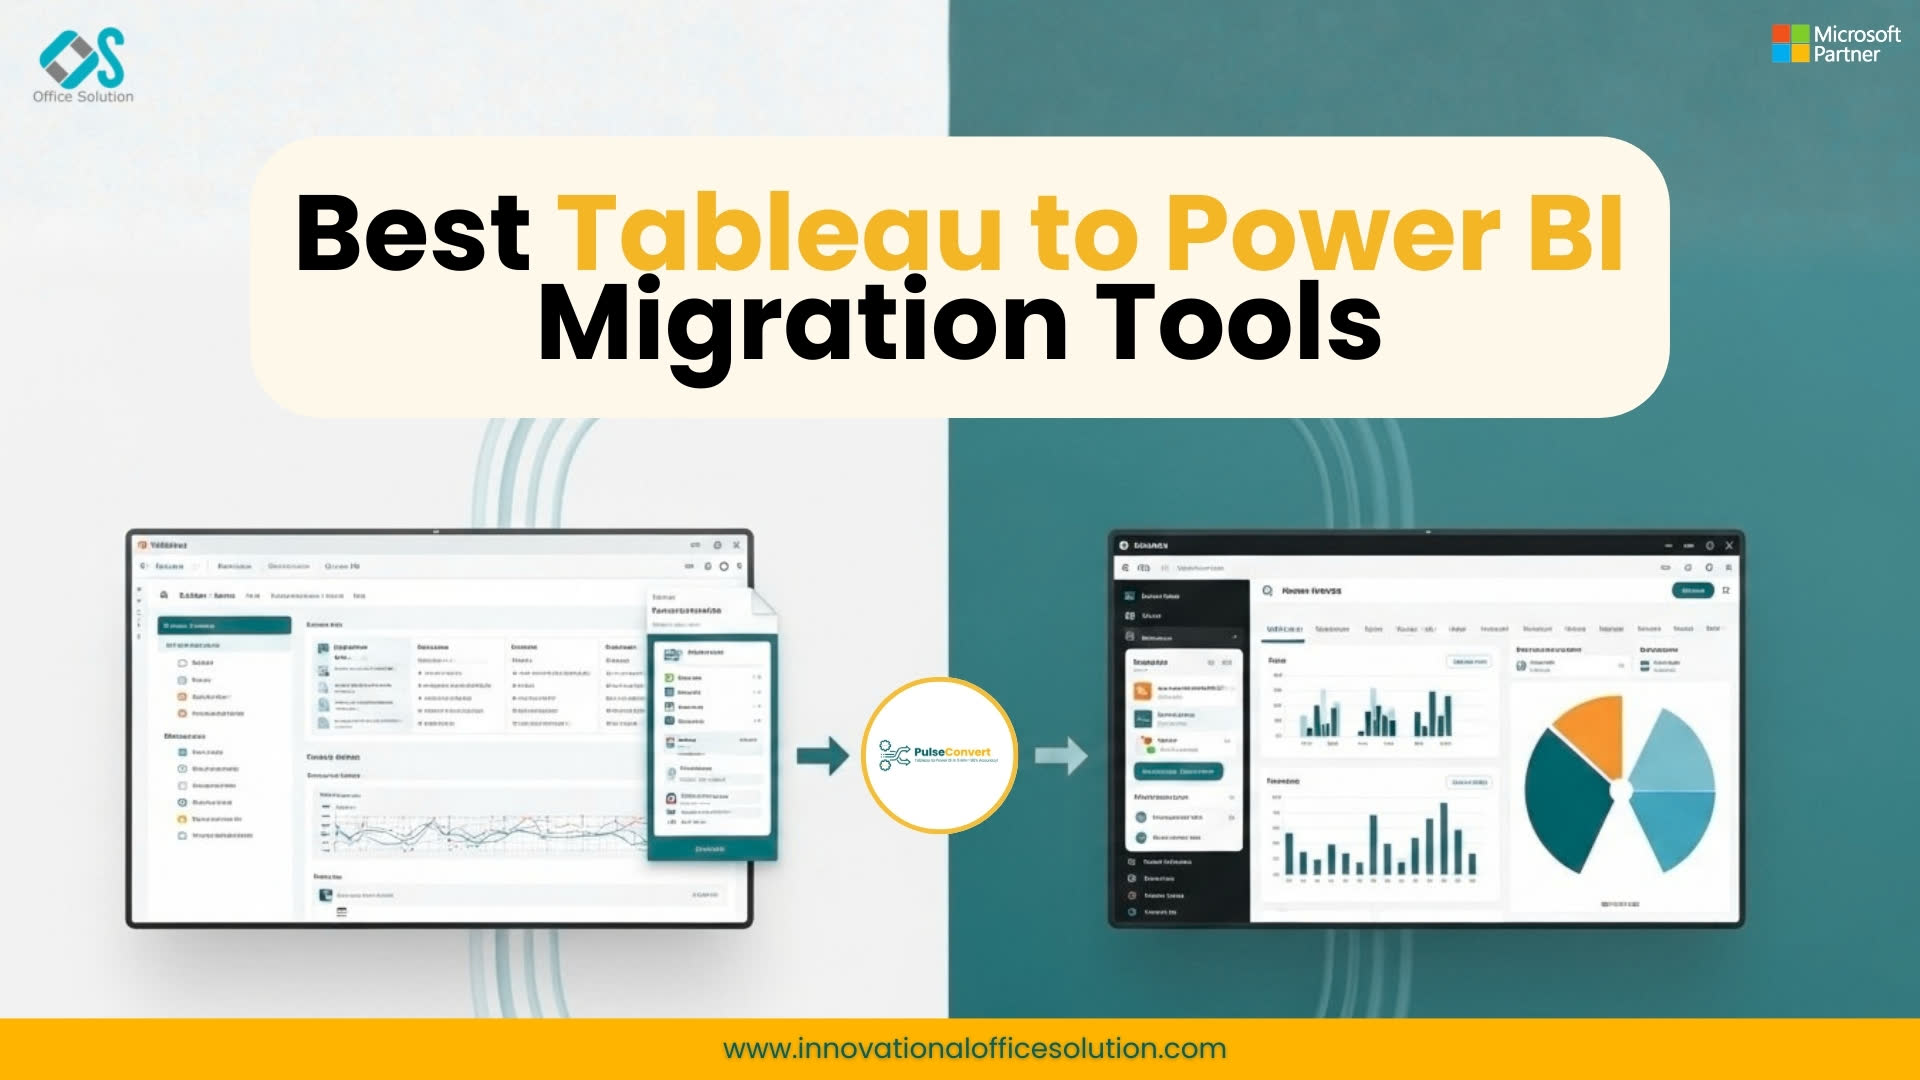
Table of Contents
Section 1: The Modern Imperative for an Enterprise BI Transformation
The modern enterprise operational landscape produces vast amounts of data every single day. For multinational corporations and scaling organizations, managing this raw information and turning it into clear executive choices has become a significant competitive advantage. However, as business intelligence tools have developed rapidly over the last two decades, many large corporate environments have accidentally built fragmented reporting ecosystems. Separate departments, regional units, and acquired subsidiaries frequently buy their own business intelligence platforms independently. This organic growth eventually results in an unmanageable mix of disconnected analytics software operating within the same corporate infrastructure.
Operating separate corporate analytical environments at a large scale introduces significant operational friction and financial strain. Technology departments face twice the maintenance work, security administrators must monitor two completely separate user permission frameworks, and corporate researchers struggle to verify contradictory numbers. This platform fragmentation costs large organizations millions of dollars annually in unnecessary software licensing fees, extra staff training costs, and complex database connector development. Consequently, modern corporate technology leaders are actively shifting away from separate departmental platforms to implement a unified, highly integrated analytical framework across the entire organization.
Standardizing corporate reporting onto a unified infrastructure is a foundational requirement of a modern BI modernization strategy. Moving reporting workloads to a cohesive platform like Microsoft Power BI allows global enterprises to simplify their data management, maximize their cloud storage investments, and build a collaborative data culture across all business units. When an enterprise standardizes its data systems, it removes the technical walls that prevent collaborative cross-functional analysis, ensuring that the finance team, the marketing department, and the supply chain division all base their operational strategies on a single, trusted source of truth.
However, moving a large business infrastructure away from an established, deeply trusted reporting environment like Tableau is an incredibly intricate, high-stakes project. Enterprise business intelligence assets are deeply tied to everyday business processes, specific accounting logic, and complex database management systems. Treating a major platform migration as a minor user interface replacement is one of the main reasons enterprise migration projects stall, overshoot their budgets, or fail to gain user adoption. To achieve true digital transformation, corporate executives must use a highly structured, phased roadmap that respects the deep architectural differences between these analytical systems.
Section 2: Evaluating the Core Differences in Architectural Design
To execute a successful Power BI migration from Tableau, engineering teams must first understand the deep differences in how these two platforms store data and process calculations. The legacy platform utilizes a highly visual, design-first workflow. In this environment, separate data sheets are often combined dynamically directly on the visualization canvas using flexible, multi-layered joins. Its calculation engine relies heavily on Level of Detail (LOD) calculations, which allow report developers to force specific data combinations directly within the visual presentation layer, completely bypassing the filters applied to the rest of the dashboard page.
In contrast, the target corporate analytics platform runs on a strict data-modeling-first framework. To deliver fast query speeds and accurate calculations, it requires data to be organized into clean relational databases, ideally structured as a star schema with distinct fact and dimension tables. Calculations are driven by Data Analysis Expressions (DAX), a functional language focused on row evaluation and active filter contexts. While the legacy platform changes data groupings directly inside individual charts, the target platform manages calculations globally by applying precise filter context overrides, making it essential for teams to fully understand a detailed Tableau vs Power BI 2026 comparison before starting structural development.
This fundamental architectural difference means that trying to translate calculation formulas line-by-line usually results in broken metrics, incorrect totals, and slow dashboards. Instead, development teams must identify the original business intent behind every legacy calculation and rewrite that logic from scratch using context-aware modeling rules. If your developers do not adjust to this structural difference, the new reports will struggle with major performance issues, requiring your engineers to spend weeks troubleshooting slow dashboards and correcting broken numbers.
Data extraction and refresh mechanisms also handle workloads differently across both software systems. The legacy environment relies on its in-memory data engine to extract and query large datasets quickly, handling heavy data transformations right inside the workbook file. The target platform uses a highly compressed columnar database engine that delivers incredibly fast query performance, but works best when data is cleaned, structured, and aggregated before it hits the report layer. Consequently, migration teams must shift heavy data cleaning tasks upstream into shared data flows, centralized cloud queries, or corporate data warehouses to keep reports running fast and scaling efficiently, as detailed in our complete guide using Tableau to Power BI migration.
Section 3: Comprehensive Inventory Audit and Strategic Categorization
The first phase of a professional migration framework is a thorough audit and assessment of your entire reporting portfolio. Over years of operation, large enterprise environments naturally accumulate hundreds of redundant, outdated, or completely abandoned dashboards. Skipping a detailed discovery phase means your development team will waste valuable time and money migrating files that nobody inside the organization actually reads anymore.
An effective assessment begins by extracting usage statistics directly from your reporting servers. By analyzing system logs and user access records, your migration team can group the entire report inventory into clear, actionable categories:
- Critical Operational Assets: Core dashboards that executives and business units rely on daily or weekly to run operations. These are scheduled for immediate migration.
- Intermittent Review Assets: Monthly or quarterly dashboards used for periodic business tracking. These are scheduled for later development phases.
- Redundant or Abandoned Assets: Reports that have not been opened by any user in the last ninety days, or duplicate layouts created by separate departments. These should be retired immediately.
Once you filter out the unused files, you must document the technical specifications of the remaining workbooks. This involves mapping out every live and extracted data connection, identifying embedded custom SQL queries, listing row-level security setups, and cataloging complex formulas. Building an accurate inventory prevents unexpected delays during development and provides project sponsors with a highly transparent view of the migration scope, providing an excellent foundation for an enterprise Tableau to Power BI migration 2026 guide implementation.
Section 4: Database Schema Mapping and Semantic Model Architecture
With a clean inventory ready, the next step in your Tableau to Power BI migration steps is building a rock-solid data foundation. The legacy platform often lets users join unrelated data tables on the fly inside a single workbook, creating flat tables that become slow and difficult to maintain over time. The target platform, however, requires a well-structured semantic model to deliver fast performance and accurate numbers across all dashboards.
Converting flat tables into a clean star schema is the most critical part of this phase. This process involves separating your data into clear fact tables (which store numeric metrics like transactions or quantities) and dimension tables (which store descriptive attributes like customer details, locations, or product types). Designing your data models this way ensures calculations run quickly, filters apply correctly across all charts, and users can safely build their own ad-hoc reports without breaking the underlying logic.
Centralizing data preparation is equally important during this phase. Instead of copying complex data transformation steps across multiple separate reports, development teams should use centralized data flows or modern data preparation engines to clean and shape data at the workspace level. This approach creates reusable data building blocks, reduces the strain on source databases, and ensures the entire organization relies on a single, trusted definition for every business metric, laying a healthy foundation for the long-term BI modernization strategy.
Section 5: Calculation Conversion and Business Logic Optimization
Rebuilding calculation logic is typically the most time-consuming and labor-intensive part of a business intelligence migration. Because legacy calculations operate independently of active dashboard visuals, recreating them in the new environment requires a deep understanding of evaluation context and filter logic.
When converting custom granularity calculations, developers cannot simply copy the formula; they must evaluate how page-level filters interact with specific charts on the dashboard. For instance, a legacy formula that locks in a specific metric regardless of page selections must be rewritten using specialized context functions to ensure filters apply correctly and return accurate numbers, an essential requirement explained in our technical guide on how to migrate Tableau to Power BI 2026.
Managing differences in data aggregation is another critical factor. The old platform handles unique counts, percentage changes, and time-based rollups dynamically based on how fields are arranged on a chart. The new platform requires explicit measures for these types of calculations to guarantee accuracy across different reporting levels. Writing clean, well-structured formulas during this step prevents subtle data discrepancies later on and makes the entire reporting system much easier to maintain over time.
Section 6: User Interface Re-engineering and Dashboard Layout Design
Rebuilding the visual layer is about balance: you want to preserve the familiar layouts your business users depend on while taking full advantage of the new platform's design strengths. Legacy dashboards often feature highly customized, dense layouts with multiple overlapping elements and floating windows. Attempting to replicate these layouts pixel-by-pixel usually leads to slow, clunky designs in the new environment.
Instead, focus on clean navigation and standardized templates. Use native grid alignment, standardized containers, and custom corporate color themes to build clean, modern interfaces. Replace complex, custom-coded navigation menus with native page navigation actions and clear drill-through paths, giving users a smoother, more intuitive way to explore their data.
Take this opportunity to optimize visual performance as well. A common mistake is crowding too many charts onto a single page, which bogs down load times because every visual sends its own separate queries to the database. Keep dashboards clean and focused—limit pages to four or five impactful visuals. Use modern tooltips, conditional formatting, and clear hierarchies to surface deeper insights without cluttering the screen or slowing down the report.
Section 7: Comprehensive Quality Assurance and Enterprise Data Validation
Data validation is the core element that builds user trust during a migration project. Even if a new dashboard looks perfect, any difference in the underlying numbers will cause business users to lose confidence in the new platform. To prevent this, you must implement a strict, multi-layered quality assurance process.
The testing process begins with automated row-level data validation. QA teams should extract data outputs from both platforms under identical filter conditions and compare them side-by-side to ensure every metric matches exactly. Any differences must be tracked down to find the root cause, which is usually a slight mismatch in calculation logic or differences in how null values are handled.
Once the numbers match, you must test system performance under realistic business conditions. This means measuring report load times when multiple users access the system simultaneously, testing scheduled data refresh cycles, and verifying that row-level security rules correctly restrict data based on user permissions. Documenting these test results provides clear proof to business stakeholders that the new platform is accurate, secure, and ready for daily operations, satisfying the strict requirements outlined in our complete guide enterprise Tableau to Power BI migration.
Section 8: Strategic Change Management and Organizational User Adoption
The final step in a migration blueprint focuses on the human element of technology shifts. If your employees do not feel confident using the new tool, your migration will struggle to achieve real business value. A successful rollout requires a comprehensive change management program that addresses user concerns and guides them through the new interface.
Instead of running generic software training sessions, design targeted workshops that address specific business roles:
- Executive Consumers: Short, focused briefings showing leaders how to access key summaries, configure mobile views, and set up automated data alerts.
- Business Analysts: In-depth training on how to use interactive filtering, export data cleanly to Excel, and build custom, ad-hoc reports safely.
- Data Champions: Advanced developer workshops focused on master data models, complex calculation structures, and workspace management.
To maintain long-term momentum, set up an internal center of excellence. This group should establish clear design templates, manage workspace governance, and host regular drop-in support sessions where users can get help with formatting and calculations. Investing in user adoption transforms your technical migration into a true data-driven success story.
Section 9: Overcoming Operational Scale Through Automated Migration Software
When managing a large-scale enterprise migration portfolio, relying entirely on manual rebuilding can introduce significant risk, human error, and project delays. Manually converting hundreds of custom dashboards, re-keying intricate multi-layer calculations, and establishing new secure data links by hand demands substantial engineering hours, which can quickly drain your internal IT resources and extend project delivery timelines by several quarters.
To bypass these heavy operational blockages, forward-thinking enterprise leaders are shifting away from slow, manual development to implement high-speed automated transformation tools. Our enterprise conversion software, Pulse Convert, provides a highly specialized answer to this scale problem. By accessing the underlying XML blueprints, data layouts, and formula blocks of your existing workbooks, Pulse Convert delivers an impressive 75 to 90% automated accuracy when converting structural analytics logic directly into the target platform's format.
Integrating specialized conversion automation into your technology roadmaps completely changes the speed and economics of your transformation project. Instead of dedicating valuable database engineers to spend months manually recreating basic charts and translating formulas line-by-line, your technical teams can focus entirely on high-value optimization tasks, comprehensive data verification, and custom user training. Utilizing advanced migration tooling ensures your technology transition stays on schedule, keeps your migration costs predictable, and allows your enterprise to realize the financial benefits of a modernized, single-vendor analytical infrastructure much sooner.
To evaluate how our advanced conversion engine can streamline your platform transition, explore our specialized migration services for more information. If you are ready to test our automation pipeline directly within your current environment, access our platform via the Microsoft commercial marketplace to secure your free trial. For personalized implementation strategies, architectural consulting, or to discuss your specific data portfolio with our migration engineering specialists, contact us today to plan your migration path.


