Architecting Enterprise BI Velocity: The Complete Blueprint for Automated Dashboard Migration Tableau to Power BI
 0|
0| 0
0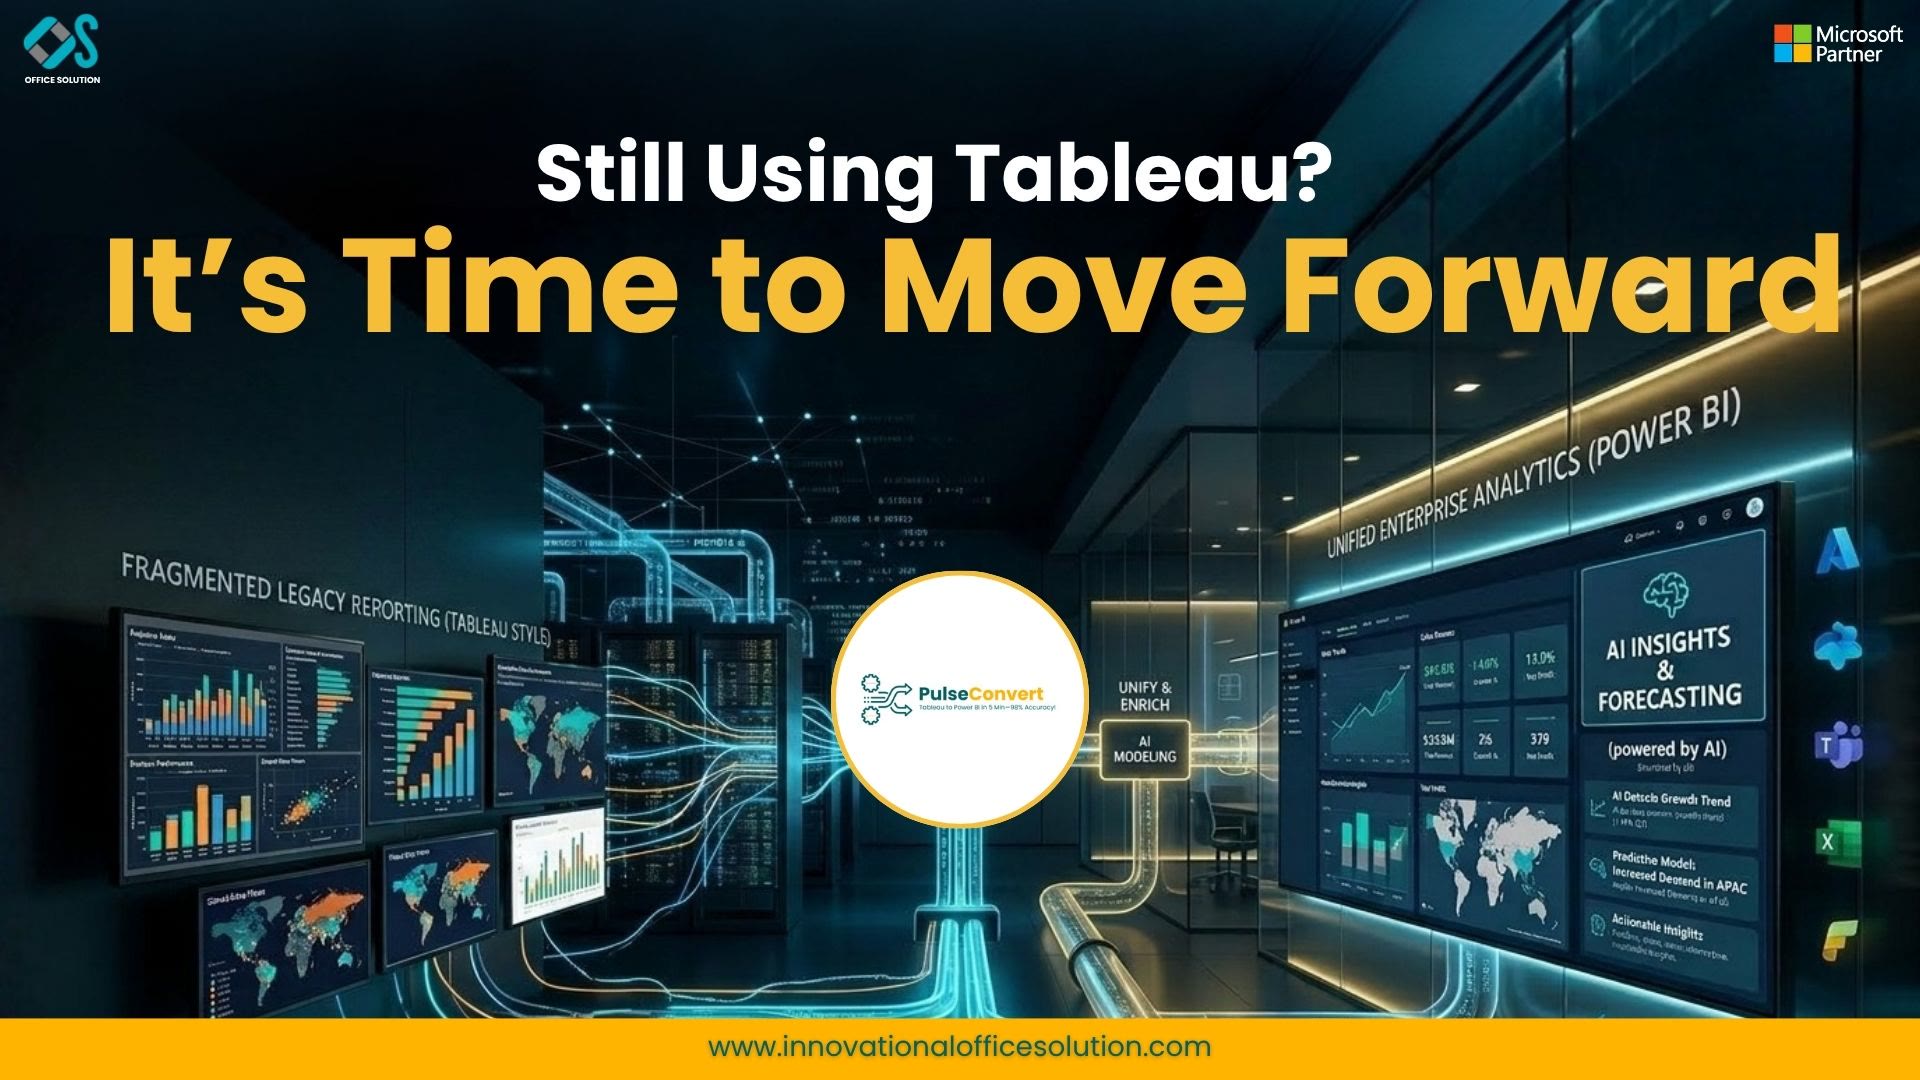
Table of Contents
Executive Summary: The Dawn of Intelligent Analytics Modernization
Enterprise data landscapes are undergoing a fundamental transformation. For over a decade, Fortune 500 organizations operated decentralized analytics models, maintaining separate reporting stacks for different business units. Teams frequently deployed Salesforce Tableau for ad-hoc, artistic visual exploration while relying on Microsoft infrastructure for centralized data warehousing and operational reporting. However, maintaining dual business intelligence platforms creates operational drag, redundant SaaS licensing fees, fragmented security governance, and duplicated data logic across departments.
As cloud analytics platforms like Microsoft Fabric mature, Chief Information Officers (CIOs) and Chief Data Officers (CDOs) are actively executing strategic platform consolidations. The objective extends beyond simply relocating static reporting assets; it focuses on achieving a seamless, automated dashboard migration via Tableau to Power BI. Transitioning reporting workloads into a unified Microsoft ecosystem enables organizations to consolidate data governance under Microsoft Entra ID while dramatically reducing software overhead.
Historically, enterprise BI migrations were stalled by the sheer complexity and cost of manual redevelopment. Traditional manual report rebuilds required dedicated engineering teams to manually inspect legacy workbooks, rewrite custom formulas line-by-line, rebuild data models, and reconstruct canvas layouts from scratch. Today, next-generation AI-driven BI migration tools have completely redefined this operational paradigm. By deconstructing XML metadata directly from source files, intelligent automation engines decode underlying data schemas, translate complex formula logic, and recreate enterprise-grade Power BI reports in minutes.
Technical Catalysts: Why Enterprise Teams Accelerate Tableau to Power BI Transitions
The decision to migrate enterprise analytics portfolios is driven by measurable economic factors, technological synergy, and long-term governance controls. Organizations executing a Tableau to Power BI modernization focus on three primary operational drivers:
1. Total Cost of Ownership Optimization
Operating standalone visualization platforms requires significant recurring financial outlays. Dedicated user tier subscriptions and per-node server core licensing scale exponentially as reader bases grow across global departments. Conversely, many enterprise organizations already hold extensive Microsoft 365 E5 or Azure enterprise agreements that include native access to Power BI capacities. By consolidating analytics spending into Microsoft Fabric or capacity-based Power BI Premium models, organizations eliminate dual-vendor subscription overlaps, cutting direct software licensing overhead by millions of dollars over multi-year cycles.
2. Architectural Evolution: Transitioning from "Viz-First" to "Model-First" Analytics
A primary technical difference between the two platforms lies in their underlying architectural paradigms. Tableau historically embraced a "Viz-First" philosophy, encouraging individual analysts to build standalone worksheets, perform on-the-fly data blending, and embed custom calculation logic directly within isolated workbook files. While this grants creative freedom to individual authors, it often generates severe technical debt, duplicated metric definitions across business units, and slow processing performance at scale.
Power BI enforces a structured "Model-First" architecture centered around standardized Star Schemas, centralized semantic models, and explicit global data governance. Executing an automated dashboard migration Tableau to Power BI converts legacy worksheets into clean, reusable semantic layers. This structural shift guarantees that key performance indicators (KPIs) remain consistent across the entire enterprise, regardless of which downstream report queries the underlying dataset.
3. Native Ecosystem Synergy and AI Readiness
Modern business intelligence operates within unified collaboration spaces. Power BI integrates natively across Microsoft Teams, SharePoint Online, Excel, and Dynamics 365. Rather than forcing decision-makers to navigate separate third-party web portals, reports live directly inside everyday productivity applications. Furthermore, unifying data assets into structured Power BI semantic models creates the clean metadata foundation required to deploy Generative AI agents and natural language querying capabilities via Microsoft Copilot.
Deconstructing the Technical Friction in Automated Dashboard Migration Tableau to Power BI
While the business case for platform consolidation is clear, executing an enterprise-wide transition involves navigating significant data engineering challenges. A successful conversion requires bridging fundamental architectural differences between the two environments:
Metadata Parsing vs. Visual Surface Scraping
Generic conversion scripts often attempt to scrape visual canvas layouts, producing superficial mockups that lack functional underlying logic. A true enterprise-grade transition requires deep metadata parsing. Specialized conversion platforms open source .twb and .twbx XML structures directly, extracting underlying SQL query scripts, connection parameters, parameter controls, visual marks, and calculated field logic. This XML metadata is then mapped into native Power BI project definitions (.pbip) or standard report files (.pbix).
Formula Logic Mapping: VizQL to Optimized DAX
Translating custom formula logic represents one of the most resource-intensive challenges during a migration. Tableau relies on VizQL calculations that operate across row-level records or visual aggregation contexts. Level of Detail (LOD) calculations—such as FIXED, INCLUDE, and EXCLUDE—allow developers to compute values at specific dimensional granularities independent of visual filters.
Power BI utilizes Data Analysis Expressions (DAX), an in-memory functional formula language that relies heavily on row contexts and filter contexts. Automated migration platforms deploy specialized parsing algorithms to convert legacy LOD syntax into equivalent DAX patterns. For instance, a Tableau {FIXED [Region] : SUM([Sales])} calculation is re-engineered as a context-aware DAX measure using CALCULATE(SUM(Sales[Amount]), ALLEXCEPT(Sales, Region[RegionName])), preserving exact analytical output without compromising VertiPaq engine performance.
Introducing Pulse Convert
Historically, the primary bottleneck in enterprise analytics modernization was the manual effort required to rewrite code, construct data models, and align canvas layouts from scratch. Manual report rebuilds typically require 40 to 80 developer-hours per complex dashboard, creating massive development backlogs and making platform transitions financially unfeasible.
Introducing Pulse Convert: an enterprise-grade automation framework developed by the specialists at Office Solution AI Labs. Pulse Convert is an AI-driven BI migration tool specifically engineered to automate and accelerate the transition from Tableau to Power BI. By deconstructing legacy workbook metadata at the node level, Pulse Convert extracts business logic, translates formula syntax, and automatically reconstructs native target reports.
The platform delivers an automated conversion accuracy between 75% and 90% out-of-the-box, depending on dashboard complexity and custom formatting requirements. What previously required months of manual line-by-line redevelopment is completed in minutes of processing time. Engineering teams are left with only a small 10% to 25% residual effort focused on fine-tuning specialized edge cases and validating final layout alignment.
Key capabilities of the Pulse Convert platform include:
- Automated Metadata Parsing: Deconstructs source .twb and .twbx XML schemas to identify data sources, parameter controls, filter chains, and visual elements automatically.
- Calculated Field & LOD Translation: Converts complex VizQL formulas, table calculations, and LOD expressions into optimized, context-aware DAX measures.
- Semantic Model Reconstruction: Maps legacy data blends, joins, and custom SQL queries into standardized Star Schema data models compatible with Power BI and Microsoft Fabric.
- Visual Layout Replication: Recreates worksheets, dashboards, color palettes, and interactive drill-through paths directly inside native Power BI files.
- Enterprise Governance & Security Mapping: Preserves role-based access rules and Row-Level Security (RLS) definitions to maintain regulatory compliance.
Deploying Pulse Convert reduces total project timelines by up to 80% and lowers execution expenses dramatically, providing a fast, risk-managed path toward cloud analytics modernization.
Complete URL Reference Directory
- Microsoft Marketplace Solution Page
- Office Solution AI Labs Platform Portal
- Enterprise Retail Migration Case Study
- Barchart Financial Feature & Accuracy Analysis
- The 2026 AI-Powered Migration Guide
- Unified Enterprise Migration Framework & Governance Strategy
- Step-by-Step Technical Conversion & Automation Guide
- Practical Enterprise Engineering & Architecture Blueprint
- Top Migration Technical Challenges & Engineering Fixes (2026 Edition)
- The Ultimate Enterprise Guide to Migrate Tableau to Power BI
Frequently Asked Questions (FAQs)
1. How do AI-driven BI migration tools accelerate dashboard conversion?
AI-driven BI migration tools automate the heavy lifting of platform shifts by reading XML metadata from legacy files. They parse data connections, visual structures, and calculated fields, automatically translating them into native Power BI files (.pbix) and DAX measures. This reduces manual development effort by up to 80%.
2. Can complex Level of Detail (LOD) calculations be converted automatically?
Yes. Modern conversion tools like Pulse Convert analyze Tableau FIXED, INCLUDE, and EXCLUDE formulas and map them into context-aware DAX expressions using functions like CALCULATE, ALLEXCEPT, and REMOVEFILTERS.
3. What level of accuracy can be expected from automated dashboard conversion software?
Automated platforms deliver between 75% and 90% accuracy out-of-the-box. Visual elements, filters, parameters, and core calculations are converted automatically, leaving developers with a minimal residual workload focused on fine-tuning custom styling or specialized edge cases.
4. How long does an enterprise-wide automated dashboard migration take?
While manual report rebuilds for 100+ complex dashboards routinely take 6 to 18 months, an automated migration pipeline using Pulse Convert compresses the entire conversion, testing, and deployment lifecycle down to 8 to 12 weeks.
5. Does automated dashboard migration preserve underlying Row-Level Security (RLS)?
Yes. Advanced migration tools parse legacy security definitions and role assignments, translating them into Power BI Row-Level Security rules mapped directly to Microsoft Entra ID (formerly Azure Active Directory).


