De-Risking the Enterprise Analytics Pivot: Why Technology Leaders Prefer a Semantic Model Architecture Over Legacy Viz Engines During a Tableau to Power BI Migration
 0|
0| 0
0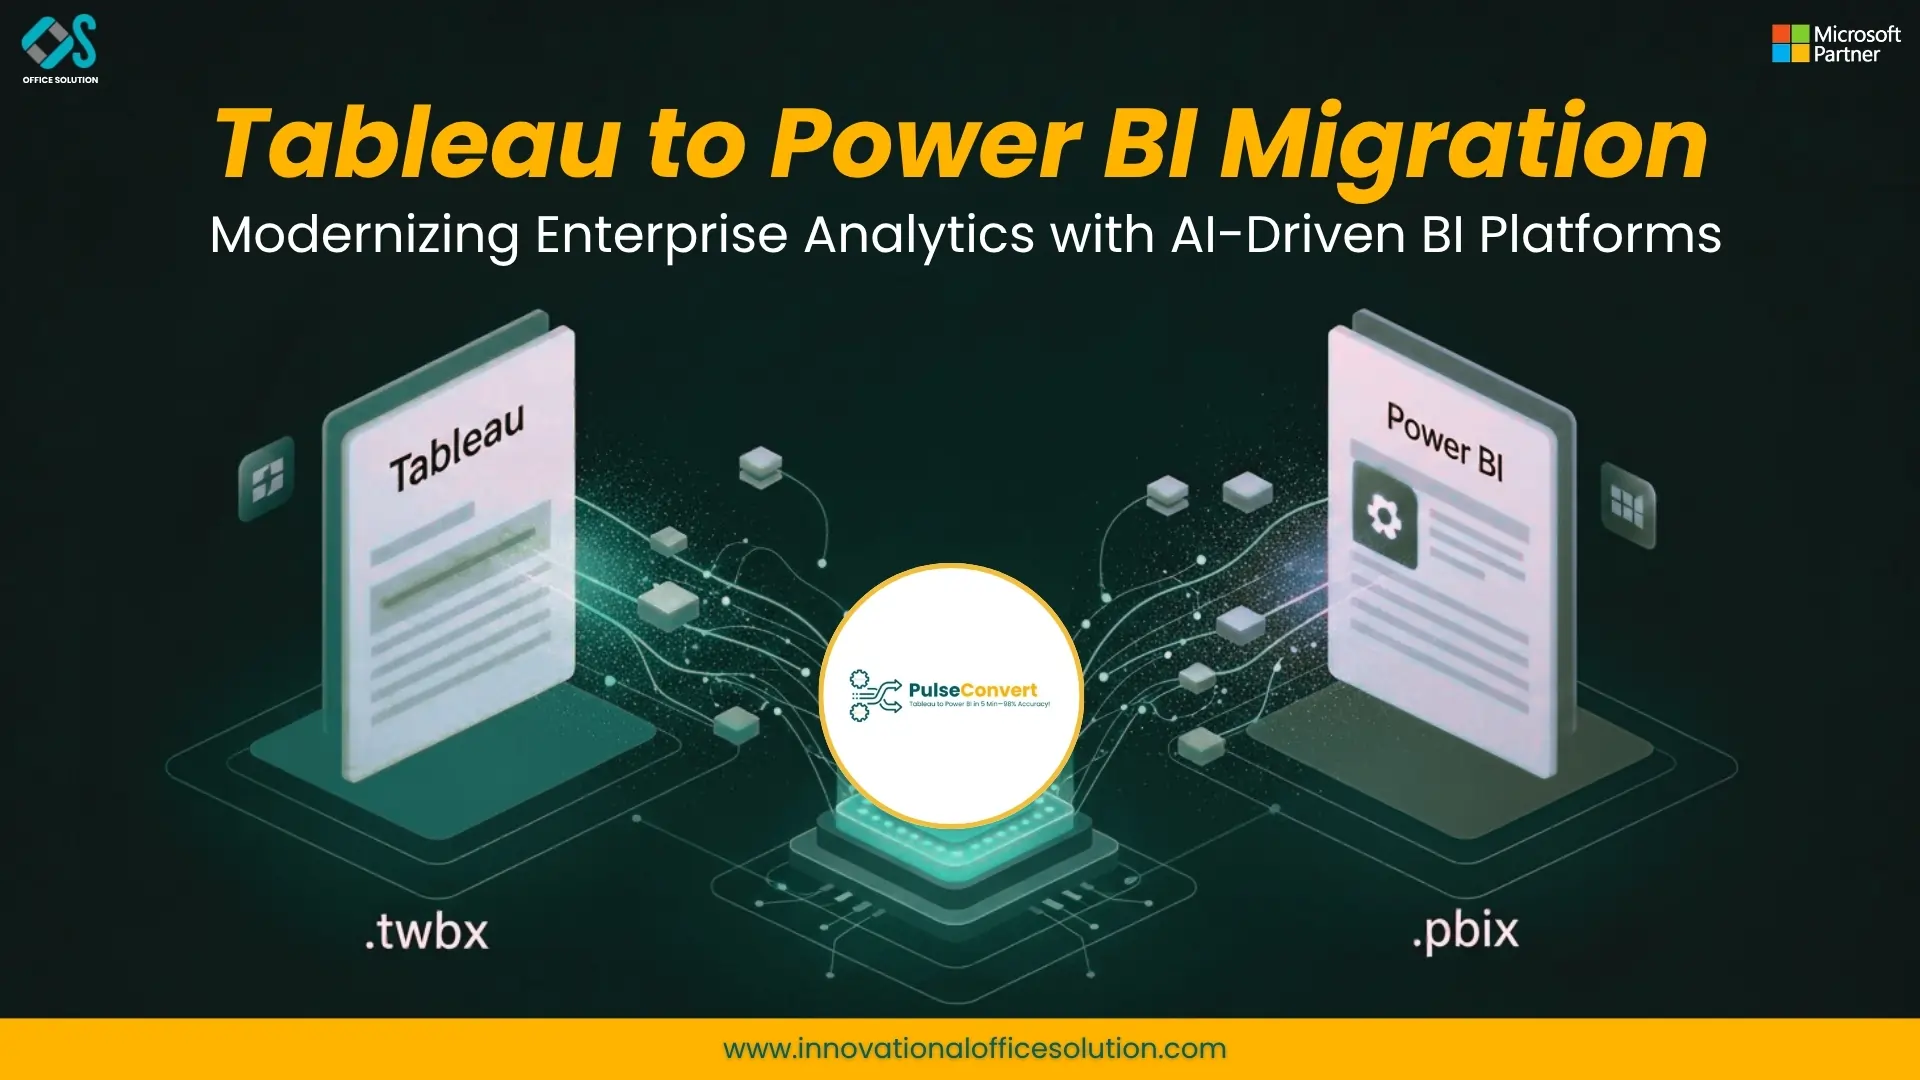
Table of Contents
The modern corporate data architecture is undergoing a major structural transformation. For over a decade, many multinational enterprises built their business intelligence frameworks around decentralized visualization tools designed to create standalone dashboards on top of localized data extracts. While this visualization-first approach provided strong graphical reporting capabilities, it has created immense operational complexity, fragmented data governance, and unsustainable licensing overhead for today's cloud-integrated enterprises. As Chief Information Officers push for unified cloud data platforms, organizations are rapidly moving away from isolated presentation layers and transitioning toward centralized semantic architectures. Achieving this modern data ecosystem requires a highly disciplined, programmatic roadmap that fundamentally changes how corporate reporting functions across the global workforce.
Moving thousands of active production workbooks between two entirely different business intelligence software engines is an intensive engineering challenge. A standard enterprise reporting deployment involves deeply nested calculation formulas, strict row-level security filters, complex cross-database joins, and specialized visual configurations. Attempting to manage this massive technical transition through manual report rebuilding is an operational dead end that consumes thousands of valuable developer hours, delays critical business insights, and introduces a high risk of human error. To execute this system transformation successfully without disrupting daily corporate operations, enterprise data teams must adopt a metadata-driven conversion strategy that maintains mathematical consistency while drastically accelerating the project delivery timeline.
Streamlining BI Migration with Pulse Convert
Pulse Convert is an AI-powered migration accelerator engineered by Office Solution AI Labs to automate the complex process of transitioning enterprise business intelligence from Salesforce's Tableau to Microsoft's Power BI. Migrating between these platforms has traditionally been a slow, manual, and error-prone ordeal due to fundamental differences in data architecture, visual frameworks, and calculation logic. Pulse Convert addresses these technical bottlenecks by delivering up to a 90% automated conversion rate. It uses an in-house trained large language model named "Pulse" to parse metadata, preserve dashboard layouts, and map complex Tableau calculated fields directly into optimized DAX expressions and Power Query models. By significantly reducing project timelines from months to days, it offers a secure, scalable path for organizations standardizing on the Microsoft ecosystem or migrating into Microsoft Fabric.
Analyzing the Structural and Financial Drivers of Corporate Platform Standardization
The decision to completely modernize an enterprise reporting footprint is driven by structural inefficiencies, runaway total cost of ownership, and weak data control. Legacy visualization platforms like Tableau are designed around a desktop-centric model where data transformations, custom calculations, and user access definitions are frequently hardcoded directly into individual workbook files. As an enterprise expands to thousands of active business users, maintaining an unmanaged ecosystem of separate files becomes highly inefficient, routinely resulting in broken data connections, conflicting corporate metrics, and elevated regulatory compliance risks.
By consolidating all analytical workloads within an integrated software-as-a-service cloud platform like Power BI, large corporations can leverage existing enterprise cloud infrastructure agreements to distribute interactive insights across the entire global organization without purchasing individual viewing licenses for every single employee. Beyond direct software licensing cost reductions, this migration enables data engineering teams to establish a definitive single source of truth. Instead of exporting isolated data extracts that constantly strain production databases, corporate development teams can establish direct connections to central cloud data storage arrays. This clean design guarantees that every business unit operates with identical data definitions, entirely eliminating conflicting metrics during critical executive alignment meetings.
Defining a Multi-Phase Blueprint for Complex Data Infrastructure Transitions
A successful, large-scale business intelligence modernization requires a formalized methodology that balances technical migration mechanics with uninterrupted business continuity. Enterprise corporations cannot afford prolonged reporting blackouts or unverified data outputs. Technology teams must implement a structured workflow that divides the conversion process into clearly defined, manageable execution stages. This programmatic approach begins with an extensive inventory discovery and system audit, followed by automated schema mapping, rigorous data logic validation, and a gradual system cutover.
Navigating the Global Inventory Discovery Phase to Eliminate Legacy Reporting Clutter
Before moving any data workloads or rewriting a single line of calculation code, data architects must complete a comprehensive technical inventory audit across all live corporate reporting servers. Legacy business intelligence systems frequently accumulate massive amounts of operational clutter over years of unmanaged development. This footprint typically includes abandoned testing workbooks, duplicate datasets, and outdated dashboards that are no longer accessed by any business unit. Attempting a literal conversion of this entire unmanaged ecosystem wastes significant engineering resources and creates unnecessary translation errors.
A systematic cloud discovery process analyzes live system metadata to categorize every active reporting asset based on actual user consumption metrics, data update frequencies, and underlying calculation complexity. This meticulous assessment helps infrastructure teams identify and delete obsolete workbooks before the migration begins, often reducing the active conversion backlog by up to forty percent. The remaining core dashboards are then organized into logical migration sprints based on their shared data sources and business priorities, establishing a highly predictable and structured tableau to power bi migration path.
Constructing Destination Workspace Environments and Enterprise Security Hierarchies
Once the core migration backlog is cleaned and prioritized, cloud infrastructure engineers focus on building the destination tenant environment to receive the incoming analytics workloads. This step involves configuring a clean workspace hierarchy, assigning data capacity allocations, and setting up robust continuous integration and deployment pipelines. Establishing these administrative and environment controls early ensures that all converted reports integrate perfectly with corporate data standards and support automated testing models immediately upon deployment.
A critical component of this structural environment preparation is mapping legacy user access privileges to modern cloud governance structures. Instead of managing security permissions manually across thousands of isolated report files, administrators configure group-based permissions at the workspace and application layers. This structural optimization ensures that only authorized user groups can view or modify sensitive business insights, significantly lowering long-term security administration workloads and eliminating potential data compliance gaps across departments.
Overcoming Foundational Engine Divergences Between BI Ecosystems
The most significant technical hurdle during an enterprise data transformation is translating custom calculation logic between fundamentally different underlying software engines. The legacy visualization platform operates on a visual-centric model, where data transformation rules and aggregation behaviors are deeply bound to the specific graphical objects placed on the dashboard canvas. Conversely, the modern Microsoft cloud environment utilizes a data-first model that separates the central semantic data model from the visual reporting layout. Managing this structural change requires an intimate understanding of how both calculation
Translating Complex Level of Detail Logic into Highly Optimized DAX Expressions
A primary technical challenge that data engineers encounter when executing a tableau to power bi migration approach is converting Level of Detail expressions into high-performance DAX formulas. The legacy architecture relies on these specialized custom formulas to compute numerical values at precise dimensions of data granularity, completely independent of whatever fields are used in the active visual layout. When companies execute a migration from Tableau to Power BI, these custom expressions must be mapped precisely to combinations of advanced DAX functions like CALCULATE, ALLEXCEPT, and SUMMARIZE.
Failing to optimize these expressions during formula translation leads to serious query delays and sluggish dashboard performance. For example, if a developer performs a direct, literal translation of a nested dimension calculation without adapting it to the optimal DAX evaluation context, the resulting query can trigger massive row-by-row scans on underlying tables. This structural inefficiency causes dashboard load times to spike from milliseconds to minutes, frustrating business users and increasing processing costs on cloud data platforms.
Centralizing Security Models via Unified Row-Level Security Rules
Maintaining absolute data privacy across disparate business units is another area that requires an intentional architectural redesign during a platform transition. In legacy visualization setups, data security is often applied through user filters embedded inside individual files or by creating separate copies of the same dashboard for different regional sales teams. This fragmented approach increases development overhead and makes auditing data privacy policies across the organization extremely difficult.
The modern cloud environment resolves this issue by implementing row-level security directly inside the shared semantic model. Data administrators define security filters once at the data layer, and those restrictions remain active across all downstream workspaces, reports, and ad-hoc queries. This centralized security model ensures that whether a manager views a summary dashboard or exports data for local analysis, the security boundaries remain perfectly enforced without requiring duplicate report files.
Modernizing the Data Ingestion Architecture for Cloud Consolidation
The true business value of an enterprise analytics transformation extends far beyond simple software license savings. By centralizing the reporting infrastructure within a unified cloud environment, organizations can dismantle stubborn data silos and build a modern, high-performance ingestion pipeline. This optimization is especially valuable for companies migrating their backend data architecture to unified cloud data lakes, where reporting tools can connect directly to central storage repositories without moving files around.
Transitioning from Heavy Workbook Extracts to Real-Time Direct Lake Connections
Legacy reporting models frequently rely on massive data extracts that must be scheduled for frequent refreshes throughout the business day. This approach strains production databases, causes version synchronization issues across departments, and introduces data currency delays. Moving to a consolidated cloud platform allows data teams to phase out these unmanaged extracts and embrace live connection options and direct lake storage architectures instead.
By connecting reporting layouts directly to high-performance cloud data warehouses, business users can execute real-time operational queries against large datasets without suffering lagging dashboard performance. This direct connection approach ensures that executive dashboards display live, accurate operational metrics, allowing management teams to respond quickly to market changes without waiting for overnight data refresh windows to complete.
Accelerating Code Translation with Advanced Automated Conversion Frameworks
Recreating hundreds or thousands of corporate dashboards manually is a slow, tedious process that frequently stalls large digital transformation initiatives. Data developers are typically forced to open every legacy file, reverse-engineer the underlying calculation logic, and manually rebuild the visual layouts from scratch within the target desktop tool. This manual method creates a massive development bottleneck, often extending enterprise migration timelines by several quarters or years.
To overcome this operational bottleneck, modern technology leaders are moving away from manual development work and integrating automated dashboard migration Tableau to Power BI software tools into their deployment plans. Utilizing advanced metadata automation through engines like Pulse Convert allows companies to achieve an automated migration of seventy-five to ninety percent of their existing dashboards and data logic. The tool reads the underlying XML metadata files, extracts the business definitions, and translates them into clean, fully functional DAX syntax, allowing data engineers to focus their energy on final visual styling and user training.
Executing Code Translation and Validating Metric Accuracy
The execution phase of a corporate reporting modernization focuses entirely on metadata ingestion, automated conversion, and rigorous data validation. To discover additional field-tested migration methods and access detailed execution frameworks, technology leaders can read our comprehensive technical transition blueprint. Business teams can also explore this technical optimization firsthand via a Free trial of our advanced conversion tools, experiencing how automated translation accelerates business transformations.
Designing Rigorous Parallel Testing and Automated Data Validation Workflows
Data validation is a vital requirement when changing enterprise business intelligence tools. Before turning off any legacy reporting servers, data engineering teams must run parallel testing routines to verify that the numbers match exactly between both environments. Running both systems simultaneously during a testing window allows teams to compare data outputs side-by-side using identical query parameters.
Automated validation scripts speed up this verification process by comparing billions of data points across both platforms, instantly flagging any variations in calculation logic or data extraction. This rigorous validation ensures that any differences caused by differing calculation engines are corrected before production deployment, giving business stakeholders absolute confidence in the accuracy of the new reporting system.
Mitigating Calculation Discrepancies through Modern Star Schema Data Modeling
When discrepancies are uncovered during parallel testing, the root cause is almost always an unoptimized data structure in the legacy workbook. The legacy platform frequently relies on complex physical joins and extensive data blending at the visualization layer, which can lead to unpredictable calculation results when processing large datasets. The modern cloud platform achieves much higher processing speeds and calculation consistency by organizing data into clean star schemas, consisting of central fact tables linked directly to independent dimension tables.
Transitioning to a structured star schema design allows the cloud reporting engine to scan highly compressed data columns in milliseconds, providing instant insights to end users. This structural optimization ensures that complex business definitions are computed uniformly across all downstream workspaces, eliminating calculation discrepancies and ensuring reliable performance under heavy user concurrency.
Managing the Human Element: Driving Adoption and System Cutover
The final phase of an enterprise data platform transformation centers on user training, operational deployment, and decommissioning legacy infrastructure. A common pitfall in large-scale tech migrations is focusing entirely on technical mechanics while failing to prepare business users for the interface changes of the new application. Even if the underlying calculations are completely accurate, users may resist the new system if they struggle to navigate the new workspace layouts or interactive filtering controls.
Implementing Structured Change Management and Role-Specific Training Programs
To prevent user friction, organizations should establish a structured change management program alongside the technical migration. For a detailed breakdown of organizational alignment strategies, technology leaders can review our comprehensive platform analysis. Providing role-specific training sessions helps business analysts adapt to the data model interface, while showing executive leaders how to interact with dashboards on mobile devices ensures smooth adoption.
Appointing power users within each department also creates an effective first line of support, helping teams resolve simple questions quickly during the system cutover. These internal advocates accelerate platform adoption by demonstrating how the new system streamlines daily reporting tasks, turning what could be a disruptive technical change into a positive business evolution.
Decommissioning Legacy Infrastructure to Realize Total Cost Improvements
Once user acceptance testing is complete and department heads sign off on the new dashboards, the company can safely begin turning off legacy reporting servers. Decommissioning this older infrastructure eliminates high software maintenance fees, simplifies software compliance tracking, and clears out data clutter. The organization is now fully optimized to leverage real-time business insights, advanced data analytics, and unified data governance across all business units.
Completing this final infrastructure cleanup ensures that the IT department fully captures the projected return on investment from the migration project. By operating a single, cohesive cloud analytics platform, the enterprise reduces its administrative footprint, lowers infrastructure overhead, and provides the global business with a high-performance reporting engine built for continuous growth.
https://innovationalofficesolution.com/blogs/tableau-to-power-bi-migration-approach/
Frequently Asked Questions (FAQs)
1. What is the primary benefit of utilizing an automated software tool for an analytics transition?
The primary benefit is the drastic reduction in manual development time and the elimination of human transcription errors. An advanced automation framework reads the underlying workbook metadata and provides a guaranteed seventy-five to ninety percent automated migration of your calculation logic and dashboard layouts. This automation ensures that complex business definitions are translated into clean expressions quickly, allowing your engineering teams to focus entirely on visual optimization and user training.
2. How do development teams handle highly complex calculations during a platform shift?
Simple calculations scale and translate directly through automated conversion tools. Complex custom formulas, such as deeply nested expressions or specific dimension calculations, are analyzed by the automation software and converted into equivalent target functions. Any highly specific visual formatting that falls outside the automated transformation range is finalized manually by data developers during the visual polishing phase.
3. Will existing data warehouse connections need to be rebuilt from scratch?
No, the underlying data warehouse infrastructure remains completely intact. However, the connection methods are updated to align with modern cloud practices. Instead of using isolated dashboard extracts, the new architecture connects directly to your central databases using live queries or unified semantic layers, ensuring better data consistency and eliminating replication delays across the global footprint.
4. How do data teams guarantee that metrics match exactly across both reporting platforms?
Data teams run parallel validation processes where both reporting platforms are updated simultaneously during a testing window. Automated validation scripts compare the metric outputs of both dashboards using identical input parameters. Any discrepancies caused by differing calculation engines are identified and corrected, ensuring complete data accuracy before going live.
5. How does software licensing change when moving to an integrated cloud platform?
The transition delivers major cost efficiencies by shifting from expensive user-specific visualization licenses to an integrated capacity model. If your company already uses enterprise cloud data suites, you can leverage existing corporate capacities to distribute dashboards to thousands of business users without paying for individual viewing licenses, drastically reducing your total cost of ownership.


