Engineering a Programmatic Migration Blueprint: Transforming Legacy Workbooks into High-Performance Semantic Layers via a Structured Tableau to Power BI Migration
 0|
0| 0
0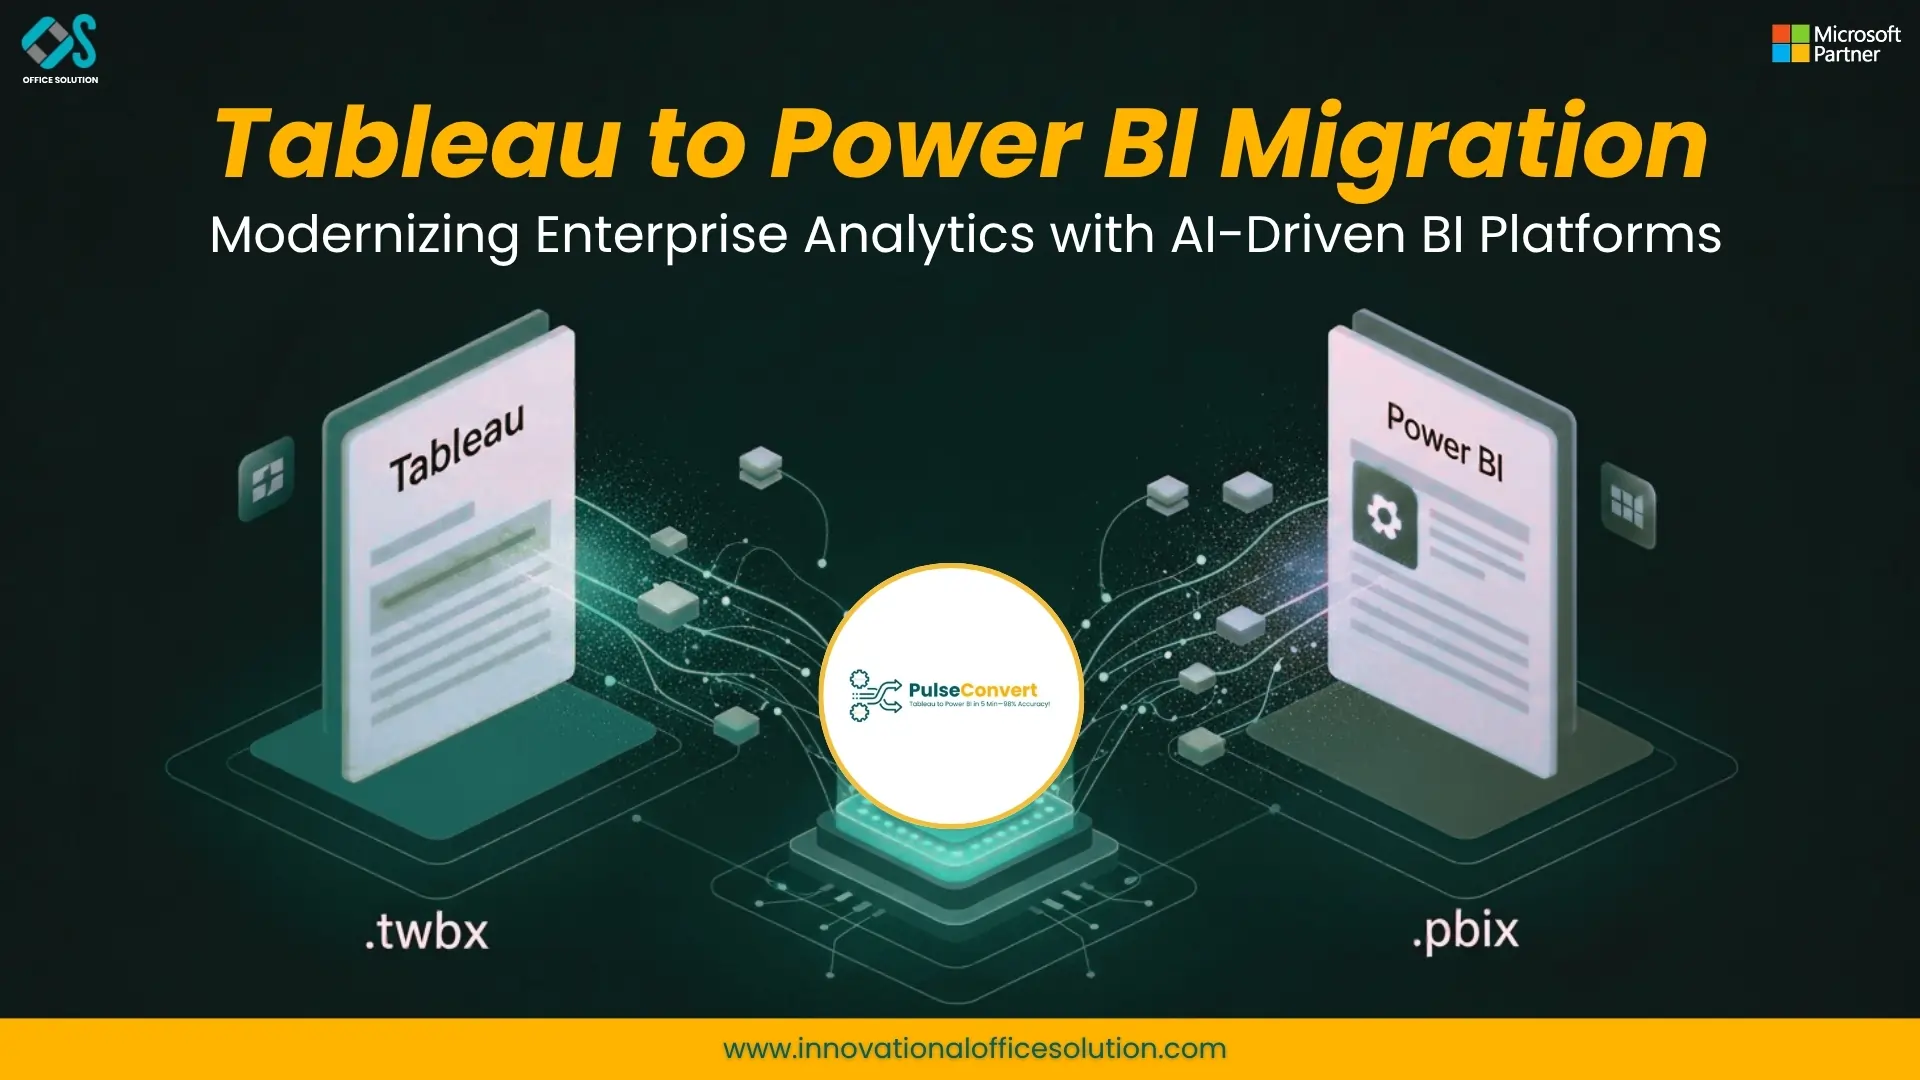
Table of Contents
The velocity of modern enterprise commerce demands a data reporting infrastructure that is both highly agile and structurally sound. As multinational corporations expand their cloud storage footprints, technology executives face intense pressure to eliminate overlapping analytics tools, dismantle redundant data extracts, and enforce unified data governance. Managing separate, isolated data visualization platforms alongside comprehensive enterprise data warehouses introduces severe administrative friction and inflates the total cost of system ownership. This operational imbalance explains why forward-thinking organizations are actively executing a strategic migration from Tableau to Power BI.
However, executing a seamless platform transition across an entire corporate infrastructure is an intricate data engineering task. A simplistic "lift-and-shift" method that attempts to copy dashboards exactly without accounting for foundational architectural differences will inevitably fail due to fundamental variations in calculation logic, data modeling mechanics, and security structures. To achieve a reliable outcome that protects historical business intelligence assets, corporate data engineering teams must implement a formalized tableau to power bi migration approach that transforms legacy workbooks into optimized, cloud-ready analytical models.
Faster BI Transition with Pulse Convert
Pulse Convert is an intelligent automation tool designed to eliminate the manual effort of migrating dashboards from Tableau to Power BI. Typically, data teams have to rebuild every visual and calculation from scratch because the platforms use completely different architectures. Pulse Convert solves this by automatically scanning your Tableau files and translating them directly into native Power BI files, saving hundreds of hours of engineering time and minimizing human error. The tool streamlines the entire process by delivering a guaranteed 75%–90% automated migration, handling the heavy lifting of data structures and layouts instantly so your team can transition quickly and predictably.
Streamlining Code Generation via Automated Metadata Conversion Engines
The secret to accelerating a complex analytics transformation lies in replacing manual development work with intelligent, metadata-driven automation software. Attempting to manually inspect and rewrite thousands of individual data formulas and visualization layers consumes critical engineering resources and delays organizational digital growth. By embedding the Pulse Convert modernization framework into the migration strategy, enterprises can achieve a guaranteed seventy-five to ninety percent automated conversion of their active dashboards and calculation definitions.
This automated migration methodology works by directly parsing the underlying XML schema configuration files of legacy reports. The engine extracts the embedded metadata aliases, connection paths, and calculation logic, instantly translating them into clean, fully functional expressions in the target environment. This automated code generation preserves decades of critical historical business logic and completes extensive system modernizations in a fraction of the time required for traditional manual re-platforming, allowing data engineering teams to focus on strategic high-value projects.
Deconstructing the Technical Phases of a Structured Migration Roadmap
A reliable enterprise analytics transformation requires a structured roadmap that addresses technical infrastructure, calculation logic, and data governance simultaneously. To learn how to migrate Tableau to Power BI without risking data loss or operational downtime, data teams must follow a formalized, multi-phase methodology. The process begins with an in-depth discovery and audit phase designed to analyze the company's entire reporting inventory and map out complex data dependencies.
Conducting a Rigorous Global Server Audit to Eliminate Obsolete Analytics Assets
During the initial discovery phase, corporate data engineering teams routinely uncover a massive amount of operational clutter, including forgotten development workbooks, abandoned testing sheets, and redundant datasets that constantly consume server memory without providing any actual business value. A comprehensive, automated systems audit evaluates and categorizes every single reporting asset based on active user view frequency, calculation complexity, and data refresh configurations.
By identifying and safely removing these obsolete reporting assets before migrating any data workloads, cloud architects can narrow their development focus to the high-priority dashboards that actively drive corporate decisions. This clean inventory rationalization process saves substantial engineering effort and significantly lowers long-term cloud hosting overhead. For an extensive technical breakdown of inventory classification methods, technology leaders can review our comprehensive platform analysis.
Engineering Enterprise Target Environments and Continuous Deployment Pipelines
Once the active conversion backlog is refined and approved by department heads, infrastructure teams pivot to engineering the destination cloud workspace environments. This administrative preparation phase involves designing a clear directory hierarchy, setting up data capacity boundaries, and configuring robust continuous integration and deployment pipelines. Laying down these foundation controls early ensures that all newly generated reports conform perfectly to corporate security guidelines and support automated visual testing from day one.
Enterprise engineering teams typically rely on automated deployment pipelines to manage the lifecycle of the new analytical assets. These pipelines govern the secure movement of data reports across development, validation, and production environments, ensuring that all code modifications are systematically checked before being deployed to the business. This modern operational workflow reduces operational deployment risks and keeps platform accessibility consistently stable across global teams.
Restructuring Calculation Engines and Relational Data Schemas
The primary technical milestone during a large-scale data platform transition is translating complex calculation fields between entirely different execution engines. The legacy visualization software relies on a canvas-centric model where data processing rules are directly embedded within separate visual parts. Conversely, the modern cloud analytics platform uses a strict data-first architecture, requiring all calculation layers, table relationships, and privacy parameters to reside within a central semantic model that sits completely separate from the presentation layout.
Mapping Complex Calculation Grids and Context-Dependent Formulas to DAX
To guarantee absolute numerical accuracy across platforms, data engineers must understand how to map legacy context-dependent equations into optimized DAX expressions. For instance, complex multi-dimensional equations that evaluate business metrics at precise, static levels of data granularity must be carefully re-engineered using advanced DAX evaluation contexts and table modifiers. For a deep dive into these explicit engine translation rules, technology leaders can examine our full platform transition framework.
Failing to carefully re-architect these expressions during formula translation leads to massive query lag and poor user responsiveness. When data teams attempt a literal, line-by-line translation of visual calculations without adapting them to a true data-first model, the target cloud engine is forced to run highly inefficient row-by-row scans on the underlying data. This structural inefficiency rapidly degrades report performance, highlighting the vital importance of a professional, semantic-centric conversion method.
Re-Architecting Flattened Tables into High-Performance Star Schema Models
In addition to calculation formula parsing, the underlying table relationships must be updated to unlock rapid dashboard response times. Legacy visualization platforms frequently perform well when querying wide, flat denormalized tables where multiple datasets are joined into a single massive file. However, the internal columnar storage engine of the modern cloud platform is built specifically for a highly structured star schema topology.
Transitioning unoptimized data connections into a clean star schema configuration—where central fact tables containing numerical metrics are linked directly to independent dimension tables containing descriptive attributes—allows the reporting engine to scan highly compressed columns in milliseconds. This structural optimization ensures that complex corporate metrics load instantly for thousands of concurrent business users, significantly reducing cloud processing overhead.
Deploying Automated Conversion Frameworks to Compress Timelines
Manually rebuilding hundreds of complex corporate dashboards from scratch is an incredibly slow, error-prone method that stresses corporate IT budgets and delays enterprise modernization goals. Data developers must manually inspect every visual layout, re-type intricate transformation formulas, and configure new chart components completely by hand. This slow, manual conversion process creates a major operational bottleneck that can stall vital corporate analytics initiatives for several months.
Integrating the Pulse Convert software accelerator into the transition strategy completely eliminates this development bottleneck. The automation engine scans the underlying metadata configurations of existing files, isolates the core calculation paths, and instantly generates clean, fully compatible DAX expressions. This tool handles the labor-intensive heavy lifting of code translation automatically, delivering an automated conversion of seventy-five to ninety percent of your dashboards and backend data logic. This efficiency allows corporate development teams to bypass manual conversion tasks and focus entirely on final dashboard design polish and user onboarding.
To help your enterprise execute this data modernization project smoothly, our dedicated technology team at Office Solution AI Labs provides field-tested implementation blueprints and specialized conversion software. We invite large organizations to evaluate our automation capabilities firsthand by requesting a Free POC, giving your engineering team a risk-free look at how our tools convert your custom data models and calculations. To connect with our technical consulting team, please visit our official contact page. Business leaders can also sign up for a Free trial of our advanced conversion software to see how automated translation can accelerate your business modernization.
Centralizing Governance and Executing Parallel Data Validation
A successful corporate analytics modernization must deliver robust, bulletproof data security alongside rapid query execution speeds. Legacy visualization platforms often suffer from fragmented, decentralized data control, where access permissions are scattered across a complex web of independent files, user groups, and server folders. This unmanaged security configuration creates substantial administrative overhead and significantly increases the risk of data protection gaps.
Implementing Centralized Row-Level Security Rules for Secure Self-Service Analytics
The modern cloud framework completely solves this governance challenge by centralizing all security logic directly within the shared semantic model layer. Data administrators configure row-level security parameters once at the data layer, and those exact privacy boundaries remain actively enforced across the entire corporation. Whether an analyst interacts with a summary executive report, executes an ad-hoc query, or builds a custom visualization layout from scratch, data access restrictions remain fully applied.
This centralized governance model protects sensitive corporate data assets while safely unlocking true self-service analytics across departments. Business units can independently build custom reports using certified corporate data models, confident that data privacy rules are applied automatically behind the scenes. This balance of control and flexibility allows companies to scale their data-driven initiatives without compromising strict regulatory compliance standards.
Running Parallel Testing Cycles to Validate Numeric Accuracy Before Cutover
The final stage of an enterprise reporting transformation centers on data validation, user acceptance testing, and final system cutover. Before turning off any legacy reporting servers, data engineering teams must implement a parallel validation strategy, running both reporting tools simultaneously during a strict testing window. During this phase, automated validation scripts cross-check the output values of both platforms using identical data inputs, quickly uncovering and fixing any calculation variations before launch.
User Acceptance Testing involves collaborating directly with business stakeholders and daily report consumers to guarantee the newly generated dashboards meet precise operational requirements. Their formal sign-off verifies that all interactive filters, automated refresh schedules, and report distributions function perfectly under production conditions. Once this validation phase is complete, production workspaces are launched across the global enterprise with centralized security rules fully active.
With the new cloud analytics architecture live and business users thoroughly trained, the organization can confidently decommission legacy reporting servers and files. This final step removes high software renewal fees, simplifies compliance auditing, and establishes a clean, unified data ecosystem. The enterprise is now fully optimized to leverage real-time operational insights and automated data workflows, transforming raw data into a powerful engine for continuous corporate expansion.
https://innovationalofficesolution.com/blogs/tableau-to-power-bi-migration-approach/
Frequently Asked Questions (FAQs)
1. How does an automated migration engine process underlying report metadata?
The automation engine processes configurations by parsing the underlying XML structure of your existing workbook files. It maps out visual properties, data connections, and calculation expressions, converting them directly into clean syntax and corresponding dashboard layouts within the new environment. This automated translation eliminates the need for manual code rewriting, instantly completing the vast majority of backend development tasks.
2. What happens to custom on-premises database connections during a cloud transition?
The destination cloud platform connects securely to internal on-premises databases by utilizing centralized enterprise data gateways. These gateways provide secure, encrypted data paths, allowing your cloud dashboards to run automated data refreshes or execute direct live queries against internal databases without requiring you to move your physical storage arrays to the cloud.
3. How do development teams manage version control after the migration is complete?
The modern cloud environment features built-in deployment pipelines that allow development teams to manage dashboard versions safely across separate development, testing, and production workspaces. This operational structure ensures that developers can build features and update data models in isolation, testing changes thoroughly before publishing updates to business users.
4. How does transitioning to an integrated cloud environment impact overall software spending?
The transition lowers costs by moving from individual user-based visualization licenses to a shared cloud capacity model. Organizations can leverage their existing corporate cloud agreements to share dashboards with thousands of employees without purchasing separate viewing licenses for every user, significantly reducing overall business intelligence software spending.
5. What steps are taken to ensure business users adapt smoothly to the new platform interface?
Organizations should establish a structured change management program alongside the technical migration. Providing role-specific training sessions helps business analysts adapt to the new workspace layouts, while appointing power users within each department creates a first line of support to resolve user questions quickly during the system cutover.
6. Where can I see a visual demonstration of how enterprise assets and dashboard metadata are migrated?
For a step-by-step visual demonstration of how enterprise assets, complex KPIs, and layout metadata are automatically mapped between these two major analytical tools, check out the Tableau to Power BI Migration Guide Video. This video illustrates how automated migration frameworks rapidly deconstruct legacy dashboards and reconstruct them into optimized cloud report layouts, minimizing manual developer rewriting.


