Maximizing Lifecycle Efficiency: A Practical Manual to Manage a Power BI Migration from Tableau
 0|
0| 0
0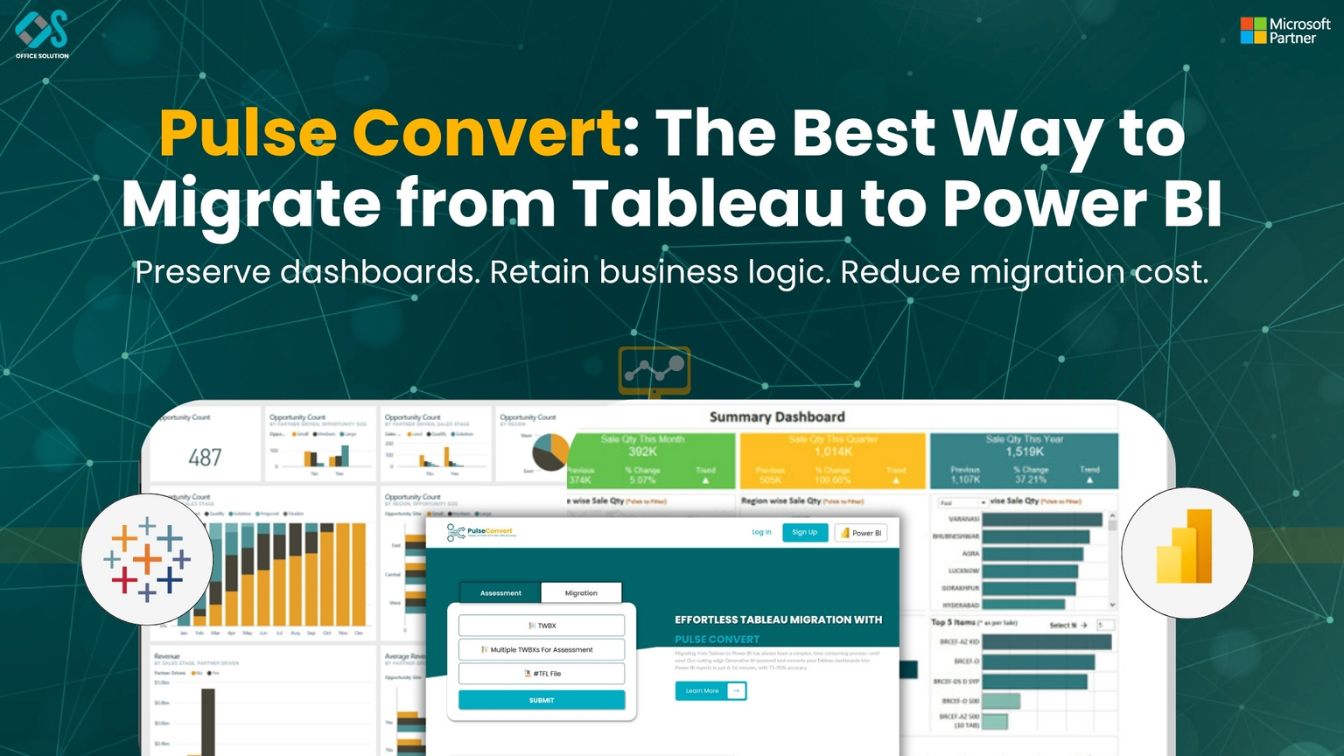
Table of Contents
Driving Analytics Modernization and Platform Cutover
Migrating a large-scale corporate data portfolio requires a highly disciplined strategy that balances engineering precision with everyday business continuity. Moving a global organization away from a legacy reporting platform involves much more than simply rewriting code and updating software applications; it requires managing a complex change management lifecycle that impacts data governance, report organization, and employee software adoption.
When planning a comprehensive Power BI migration from Tableau, data leaders must avoid treating the project as a hurried visual copy exercise. Instead, a successful transition requires a structured approach that cleans up your legacy reports, standardizes your data layers, and optimizes system performance. This execution guide breaks down the essential technical steps to move your enterprise safely into a unified, high-performing cloud workspace.
Phase 1: Portfolio Clean-up and Eliminating Legacy Asset Friction
The first practical phase of a successful roadmap to migrate from Tableau to Power BI requires a deep audit of your active report environment. Over years of fast-paced business operations, enterprise report servers tend to accumulate a massive amount of digital clutter, including abandoned ad-hoc tests, old sandboxes, and duplicate reports that are no longer actively monitored.
Data leaders should run automated usage logging scripts to analyze exactly how often individual workbooks are accessed, which departments rely on them, and which data connections are pulled. Sorting your reports into clear action tracks—Migrate, Consolidate, or Decommission—allows you to clean up your environment early. If an operational dashboard has not been opened by a business user in the past two quarters, it should be safely archived rather than moved. Consolidating highly similar variations down to a single, unified report view can frequently shrink an enterprise dashboard footprint by 30% to 40%, significantly lowering development costs and speeding up your timeline.
Phase 2: Manual Development vs. Automated Lifecycle Execution
Once you have mapped out your active report inventory, your next step is deciding how to execute the conversion. Choosing the wrong approach can lead to blown budgets and missed deadlines.
The Friction of Manual Rebuilding
A traditional manual rebuild requires software developers to analyze a legacy workbook on one computer monitor and recreate every chart, calculation rule, and visual layout from scratch on a separate screen. This slow approach often takes between 40 to 80 dedicated engineering hours per dashboard, creates long development backlogs, and introduces human copy-paste errors that distort core corporate data.
Accelerating Production via Automated Engines
To eliminate these delivery risks, modern enterprise data groups use automated migration tools to speed up technical development. Leveraging an intelligent translation engine allows companies to convert legacy files quickly and cleanly, keeping their senior analytics teams focused on high-value data modeling, data quality assurance, and user onboarding.
Introducing Pulse Convert
Within the market of automated conversion software, Pulse Convert serves as an essential automate BI conversion platform for enterprise platform modernizations. Built by the experts at Office Solution AI Labs, this specialized platform integrates into the Microsoft commercial landscape to completely automate the manual visual layout translation and formula conversion process.
Pulse Convert directly analyzes the internal XML source code of legacy workbook files, automatically converting them into fully functional, native cloud reporting assets. The platform's conversion engine achieves an impressive 75 to 90% automated accuracy. It instantly maps layout spacing, colors, and dashboard parameters while translating complex calculation logic into clean, high-performance expression strings.
Integrating Pulse Convert into your migration process compresses overall development timelines by up to 70% to 80%. Instead of spending months manually dragging and dropping charts, engineering teams can generate polished visual layouts in a matter of minutes. This rapid conversion helps companies meet strict project deadlines, eliminate overlapping license costs on time, and quickly deliver a robust, modern business intelligence environment to their users. Technology teams can easily access this specialized tool through the official Microsoft Commercial AppSource listing.
Phase 3: Building a Performant Star Schema Architecture
The third step of the Tableau to Power BI migration process focuses on setting up a high-performance data architecture within your target cloud environment. This stage is where you establish long-term report responsiveness and database stability.
To ensure fast page load times and snappy interactive filtering for business users, data engineers must structure data models into clean star schemas. This requires separating raw source data into central fact tables (which store numeric transactions and core business events) connected to separate dimension tables (which store descriptive fields like dates, customer locations, or product details). Organizing your data into a clean star schema allows Power BI's in-memory VertiPaq database engine to compress records efficiently, leading to fast query responses even when analyzing massive enterprise datasets.
Phase 4: Translating Metrics Logic and Managing Filter Flows
The fourth step involves moving your business logic from legacy formulas into Power BI's calculation language. This phase requires a strong understanding of how filters flow through a relational data model.
Tableau reports often place complex calculations directly onto individual visualization cards. In Power BI, best practices require building global, context-aware measures that evaluate dynamically based on active dashboard filters. This ensures that your calculations remain accurate and consistent, no matter which visual or report page they are added to. If a migrated report runs slowly, the issue is rarely caused by the visual layout; it is almost always due to inefficient calculation formulas or an unoptimized data schema. Keep your data models clean, handle heavy data transformations upstream within your cloud data warehouse, and write clean, optimized DAX formulas to keep your dashboards fast and responsive.
Phase 5: Verification Tracks and a Safe Platform Cutover
The final phase of the Power BI migration from Tableau centers on deployment governance, rigorous data verification, and user onboarding.
Programmatic Data Auditing
Avoid relying on simple visual checks to verify numbers across a large report catalog. Instead, use programmatic testing methods to run validation queries across both systems simultaneously, ensuring that totals, averages, and filtered sub-aggregates match perfectly across all historical periods.
Parallel Running Windows
Once your numbers are fully validated, launch a structured parallel running window, typically lasting two to three business weeks. During this transition period, business teams run daily operations using both platforms side-by-side. This parallel phase gives users a familiar safety net, ensures all business logic behaves exactly as expected under real-world conditions, and builds full operational trust before you safely turn off the legacy server infrastructure.
Industry Reference Links
- Corporate Analytics Hub: Office Solution AI Labs
- Long-form Architectural Analysis: Operationalizing the Modern Analytics Shift
- Automated Conversion Tools Guide: Best Tableau to Power BI Migration Tools
- Global Enterprise Case Study: Retail Enterprise Tableau to Power BI Migration Case Study
- Commercial AppSource Application: Pulse Convert
- Technical Deployment Guide: Pulse Convert Rank
- Global AppSource Integration Portal: Tab to Power BI
- Modernization Strategy Portal: Tableau to Power BI Migration
- Cloud Consultation Desk: Contact Us
- Comprehensive Transition Walkthrough: How to Migrate Tableau to Power BI 2026
Frequently Asked Questions (FAQs)
1. What are the first concrete development steps in a phased Tableau to Power BI migration process?
The process begins with an automated catalog audit. Data teams extract system metadata and usage logs from the legacy server to evaluate actual user engagement, allowing them to decommission outdated or duplicate dashboards early and compress the overall project scope.
2. How can data architects handle Tableau parameter controls when you migrate from Tableau to Power BI?
Automation platforms like Pulse Convert analyze parameter properties inside the legacy source files and automatically map them to native Power BI elements, such as What-If parameters or distinct disconnected dimension tables, ensuring interactive dashboard features continue to work smoothly.
3. Why is an optimized star schema structural design recommended for cloud analytics?
Power BI's columnar database engine is specifically built to compress and filter structured relational tables. Reorganizing flat data layers into central fact and dimension tables allows the system to process queries in-memory, keeping dashboard interactions fast as data scales.
4. What is the safest way to execute an enterprise platform cutover without disrupting daily business?
The safest strategy is running a fixed parallel window for two to three weeks. This allows business analysts to run daily operational reports in both platforms simultaneously, providing a reliable way to double-check data precision before decommissioning the old system.
5. How can technology leaders verify the visual conversion quality of their dashboards before a full rollout?
Through a formal commercial partnership with Microsoft, Office Solution AI Labs offers a zero-liability Proof of Concept (PoC) for enterprise clients. This program lets you convert up to 5 complex production dashboards for free, allowing you to test conversion speed and visual precision firsthand.


