Overcoming Legacy Analytical Debt: A Blueprint for an Enterprise Tableau to Power BI Migration
 0|
0| 0
0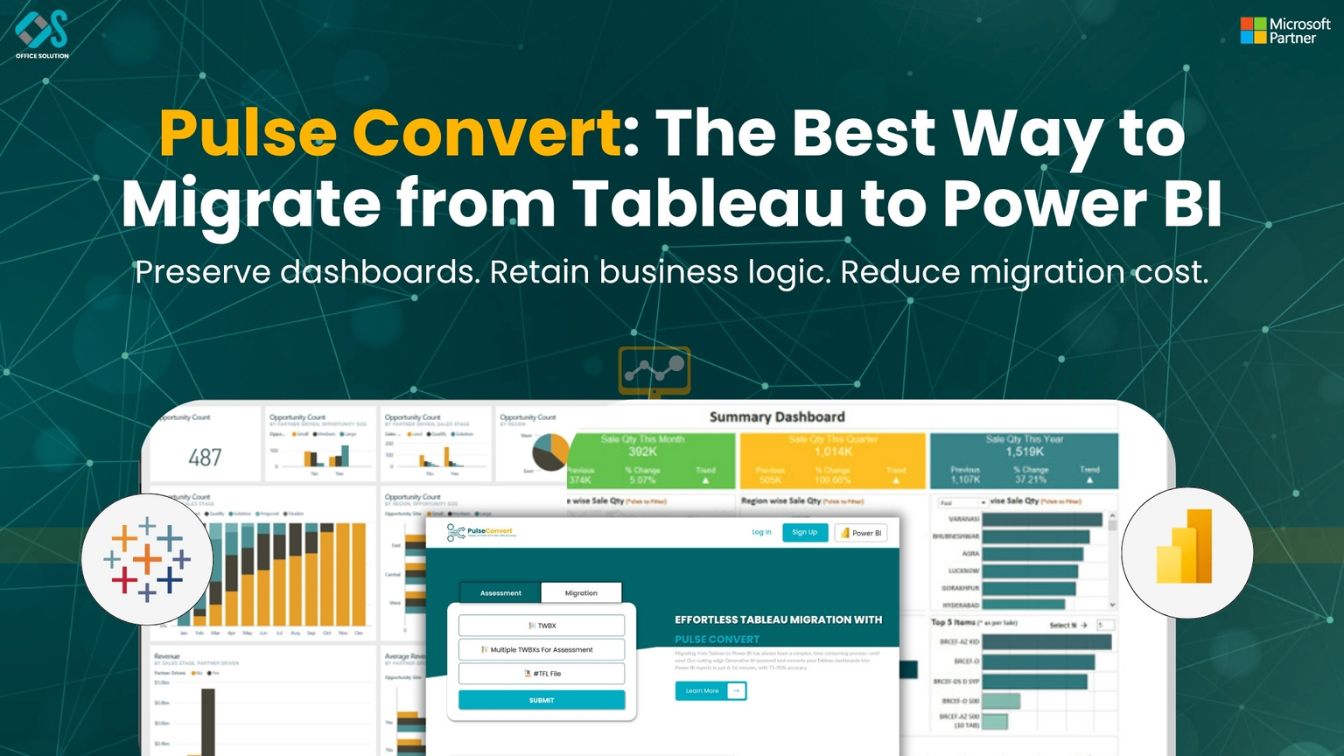
Table of Contents
Redefining Business Intelligence at Scale
Modern enterprises operate in highly competitive data environments where speed, efficiency, and platform unity determine organizational success. Over the past decade, corporate data departments frequently acquired multiple competing analytical packages to serve separate business teams. This led to fragmented data environments, high double-licensing overhead, and disjointed reporting logic. Today, data leaders are aggressively unifying their business intelligence operations under cohesive cloud infrastructures, driving a substantial wave of platform modernizations.
Transitioning your entire analytics footprint through a comprehensive tableau to power bi migration requires deep engineering control. Moving away from isolated workbook frameworks toward integrated data networks like Microsoft Fabric is a foundational corporate change. It drastically improves cross-department data sharing, reduces licensing friction, and establishes an agile analytical environment.
However, moving a vast catalog of highly interactive production dashboards presents clear engineering challenges. Tableau relies on a custom server infrastructure and highly specialized visual mechanics. Transitioning to a decoupled cloud framework means data leaders must meticulously manage change, restructure underlying schemas, and use sophisticated AI-driven BI migration tools to ensure continuous operations.
The Operational Costs of Legacy Technical Debt
Before launching an enterprise-wide data transformation project, IT teams must confront the reality of legacy technical debt. Over years of rapid operational shifts, corporate servers inevitably become cluttered with unmonitored reporting assets. This clutter includes outdated ad-hoc tests, old sandboxes, and duplicate report variations built by disconnected business divisions.
If an enterprise tries to migrate from Tableau to Power BI by lifting and shifting every workbook without checking usage trends, the project will quickly run into major operational delays. Moving obsolete or duplicate reports wastes valuable engineering hours and complicates user adoption in the new workspace. A successful modernization project requires a rigorous analytical inventory audit. It is vital to track down and decommission zero-engagement reporting sheets before writing a single line of database code.
Structural Differences: Workbook-Centric vs. Decoupled Semantic Models
The core technical challenge when executing a migration from Tableau to Power BI stems from the foundational architectural differences between the two systems. Treating the new cloud workspace as a basic chart-copy target is a common error that directly degrades dashboard responsiveness.
Tableau relies on a workbook-centric setup. In this environment, structural data connections, specialized calculations, and visualization properties are permanently bound within single report files (.twb or .twbx). This design provides immense flexibility for visual creators but naturally produces unmanaged data silos across business groups.
Conversely, Power BI operates on a disciplined, decoupled, model-first framework. It splits the underlying metric logic and table relationships into a central semantic layer, completely detached from the front-end presentation canvas (.pbix). This structural decoupling forces teams to change how they think about data architecture. It requires moving ad-hoc calculations out of visual elements and embedding them directly into a central, governed data model.
Deconstructing Formula Syntax and Context Drift
A key challenge during the transformation lifecycle is translating complex calculations. Tableau relies on internal Level of Detail (LOD) syntax (FIXED, INCLUDE, EXCLUDE) to compute metrics at specific dimensional boundaries, regardless of the active filters on a page.
When figuring out how to migrate Tableau to Power BI, developers must translate these formulas into Data Analysis Expressions (DAX). DAX is a highly optimized functional language that calculates values dynamically based on row and filter contexts. Translating an isolated Tableau LOD string into a performant DAX calculation requires a thorough understanding of filter propagation across related tables. Engineers must use functions like CALCULATE, ALLEXCEPT, and SUMX to ensure the new cloud visuals display identical financial numbers while running efficiently.
Introducing Pulse Convert
To eliminate the high engineering costs, human translation bugs, and project backlogs tied to manual migration methods, modern corporate data teams use specialized automation platforms. Within the digital transformation space, Pulse Convert stands out as an essential enterprise-grade conversion engine. Built by the analytical software experts at Office Solution AI Labs, a certified Microsoft Partner, this system connects directly to legacy reporting assets to completely automate structural layout translations and formula parsing.
The underlying technology inside Pulse Convert delivers an impressive 75 to 90% automated accuracy when reading and parsing the internal metadata of legacy files. Rather than forcing data teams to spend months manually dragging charts and rewriting individual formulas from scratch, Pulse Convert processes workbooks into native Power BI formats in a fraction of the time. The platform accurately translates data hierarchies, interactive filter groups, and specific formatting variables into clean, ready-to-use cloud assets.
By automating up to 90% of the manual migration workload, Pulse Convert completely changes the economics of analytics modernizations. Senior data engineers can step away from tedious layout reconstruction and focus entirely on verifying data precision, optimizing advanced cloud semantic models, and configuring data protection policies. This automated approach ensures that companies can meet tight transition deadlines, decommission legacy software licenses on time, and build a high-performing business intelligence workspace.
Reshaping Flat Extractions Into Performant Star Schemas
A high-performing cloud reporting environment depends on clean database architecture. Legacy workbooks often rely on flat, denormalized data extractions or long custom SQL queries tailored to a single dashboard view. Importing these unoptimized flat structures directly into a modern workspace will degrade report performance.
To ensure fast query response times, data engineers must reshape flat data layers into optimized relational star schemas. This modeling phase involves separating data into central fact tables (which store numeric transactions and core business events) surrounded by descriptive dimension tables (which store attributes like dates, customer locations, or product details).
Organizing data into a clean star schema allows Power BI's in-memory VertiPaq database engine to compress data efficiently and process queries directly in-memory. This structure ensures that filters behave predictably across all connected charts, reduces cloud memory usage, and provides business users with a clean, fast self-service environment.
Protecting Corporate Assets with Row-Level Security
Enterprise data governance requires preserving security rules during a platform migration. If your legacy workbooks use custom user filters or specific database entitlements, these must be mapped to native Power BI security frameworks.
Data engineers must build explicit security roles directly within the model layer, configuring Row-Level Security (RLS) rules using DAX filter expressions. Syncing these security roles with your central directory via Microsoft Entra ID groups ensures that data viewing privileges update automatically as employees change roles or exit the company, keeping your data fully secure and compliant with strict global privacy laws.
Industry Reference Links
- Corporate Analytics Hub: Office Solution AI Labs
- Long-form Architectural Analysis: Operationalizing the Modern Analytics Shift
- Automated Conversion Tools Guide: Best Tableau to Power BI Migration Tools
- Global Enterprise Case Study: Retail Enterprise Tableau to Power BI Migration Case Study
- Commercial AppSource Application: Pulse Convert
- Technical Deployment Guide: Pulse Convert Rank
- Global AppSource Integration Portal: Tab to Power BI
- Modernization Strategy Portal: Tableau to Power BI Migration
- Cloud Consultation Desk: Contact Us
- Comprehensive Transition Walkthrough: How to Migrate Tableau to Power BI 2026
Frequently Asked Questions (FAQs)
1. How do automated AI-driven BI migration tools handle Tableau Level of Detail expressions during conversion?
Advanced automation tools like Pulse Convert analyze the logical structure of Tableau LOD formulas and map them to optimized DAX formulas. They use context-aware functions such as CALCULATE, SUMX, and ALLEXCEPT to ensure that the filters calculate properly inside the target relational model.
2. Can we maintain our active row-level security configurations when moving platforms?
Yes. Secure migration strategies require mapping Tableau’s manual user filters to native Power BI Row-Level Security frameworks. These security configurations are tied directly to corporate identity providers like Microsoft Entra ID, ensuring that data access rules are automatically enforced across all cloud workspaces.
3. What is the average timeline reduction achieved by incorporating automated migration tools?
Using AI-driven platforms like Pulse Convert typically reduces project timelines by 70 to 80% compared to traditional manual rebuilding. The automated engine handles the time-consuming process of rebuilding layouts and converting formulas, allowing development teams to focus purely on testing and final optimization.
4. Why is transforming flat data extractions into a star schema necessary during a migration?
Power BI's underlying VertiPaq engine is explicitly optimized for relational star schemas. Restructuring your data into clear fact and dimension tables allows the engine to compress data efficiently, resulting in faster query performance and highly responsive visuals.
5. Is there a way to test automation tools with our own corporate data before committing to a full deployment?
Yes. Through a verified partnership with Microsoft, Office Solution AI Labs provides a risk-free Proof of Concept (PoC) that converts up to 5 complex enterprise dashboards with zero financial liability, allowing you to validate conversion accuracy firsthand.


